
Energy Management System — Tech OVN Energy Intelligence Platform
Tech OVN's energy management system is the Energy Intelligence Platform: cloud software that reads Titan meters and shows live three-phase values, fleet health, energy analytics, power quality against statutory limits, cost against your own tariff, BESS sizing, CO₂ reporting, alerts, and reports in CSV, Excel and PDF. It costs ₹120 per meter per month + GST.
- Minimum 1-year subscription
- 1-week free trial
Export: US$5 / €5 per meter per month · no GST on export invoices · payment with PO
What the Energy Management System Does
An energy management system (EMS) measures electricity across a site continuously and turns the readings into something a person can act on. The Tech OVN Energy Intelligence Platform does four things with the readings from your Titan meters.
- Watch
- Live three-phase telemetry, fleet health, and alerts that say where the problem is and whether it is getting worse.
- Understand
- Demand profiles, trends, comparison between meters, and power quality measured against statutory limits.
- Cost
- Energy priced against your own tariff, the effective rate per unit, and which circuit spent the money.
- Share
- CSV, Excel and PDF, on demand or scheduled by email, carrying the same figures as the screens.
- 216–244 V
- the statutory band, checked on every reading
- 0.90
- power factor, where the penalty usually starts
- 2%
- the NEMA limit on voltage unbalance
Looking for circuit-level monitoring on a factory floor rather than the software? See the industrial energy monitoring system.
One Product, One Login
Everyone in the organisation signs in to the same place. What each person is shown follows their role. The screens fall into four groups, and the rest of this page walks through them in order.
- Monitoring
- Overview, Live monitoring, Devices & health, Meter detail
- Analysis
- Energy analytics, Trends, Multi-meter compare, Power quality
- Cost and operations
- Cost & tariff, Alerts & events, Data collection, Reports
- Administration
- Users & roles, Settings, Organisations
Screens shown are the running product against live meters. Figures are from a demonstration environment.
Overview
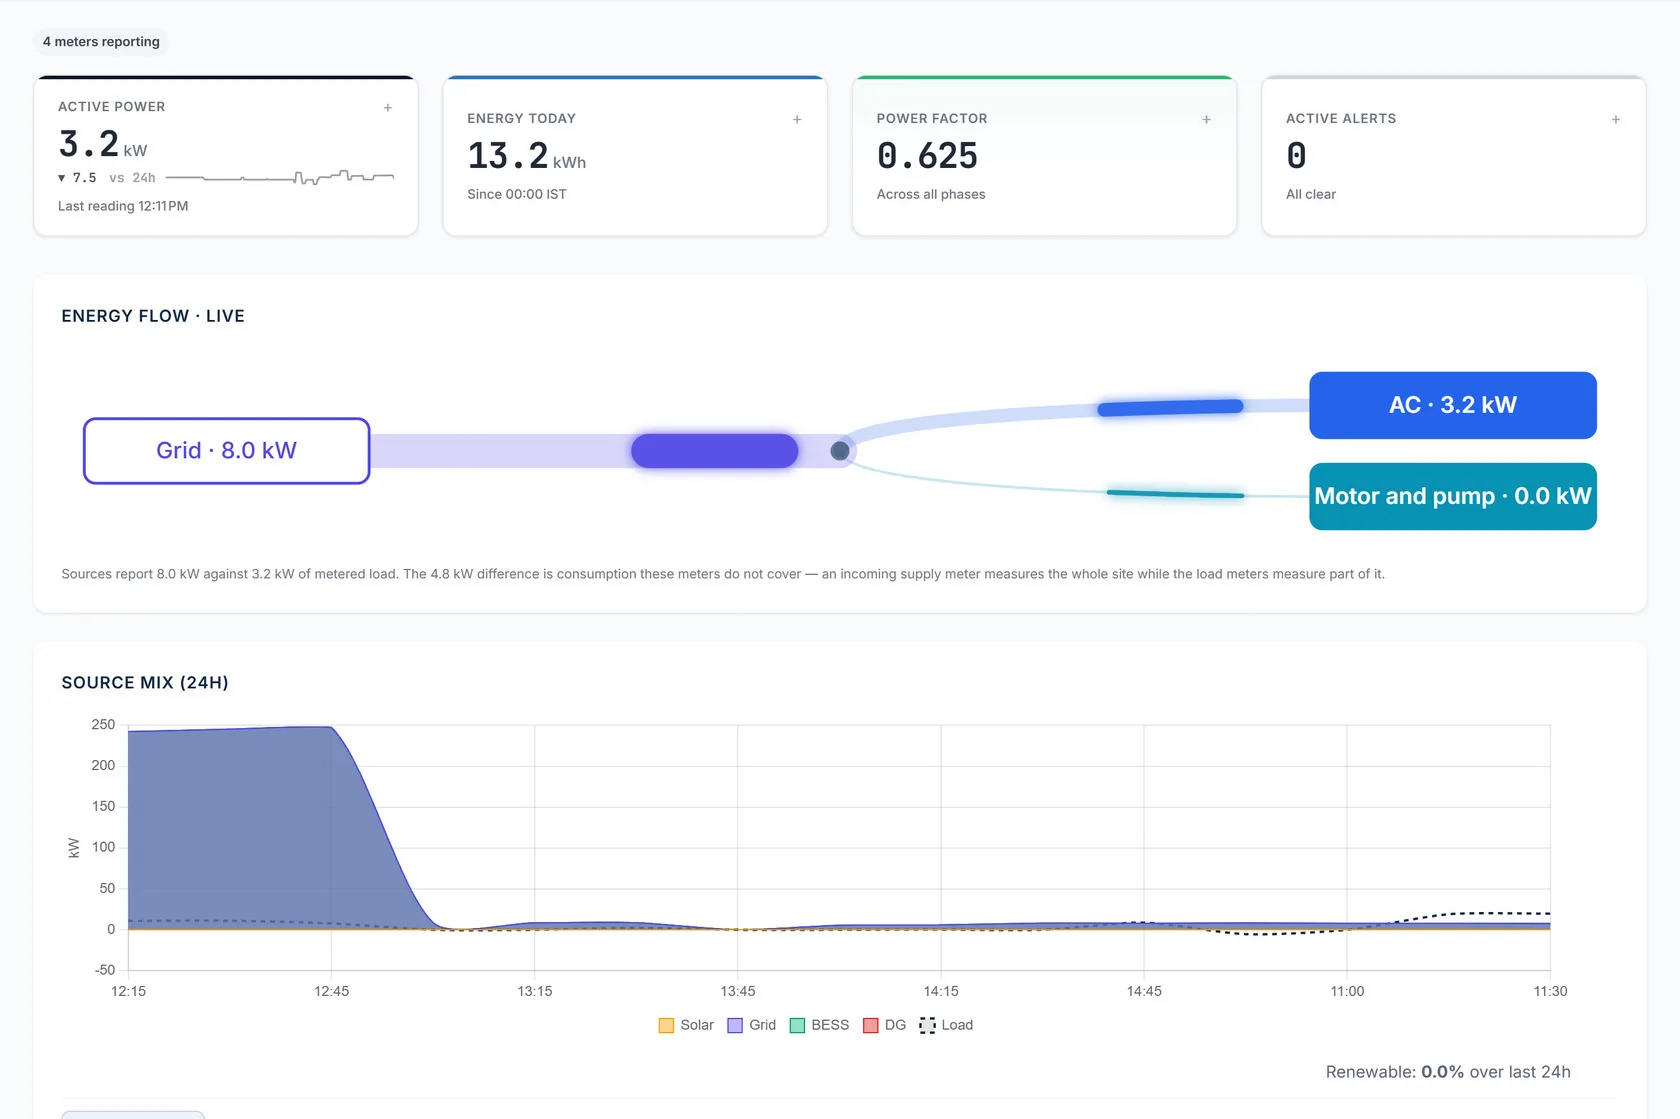
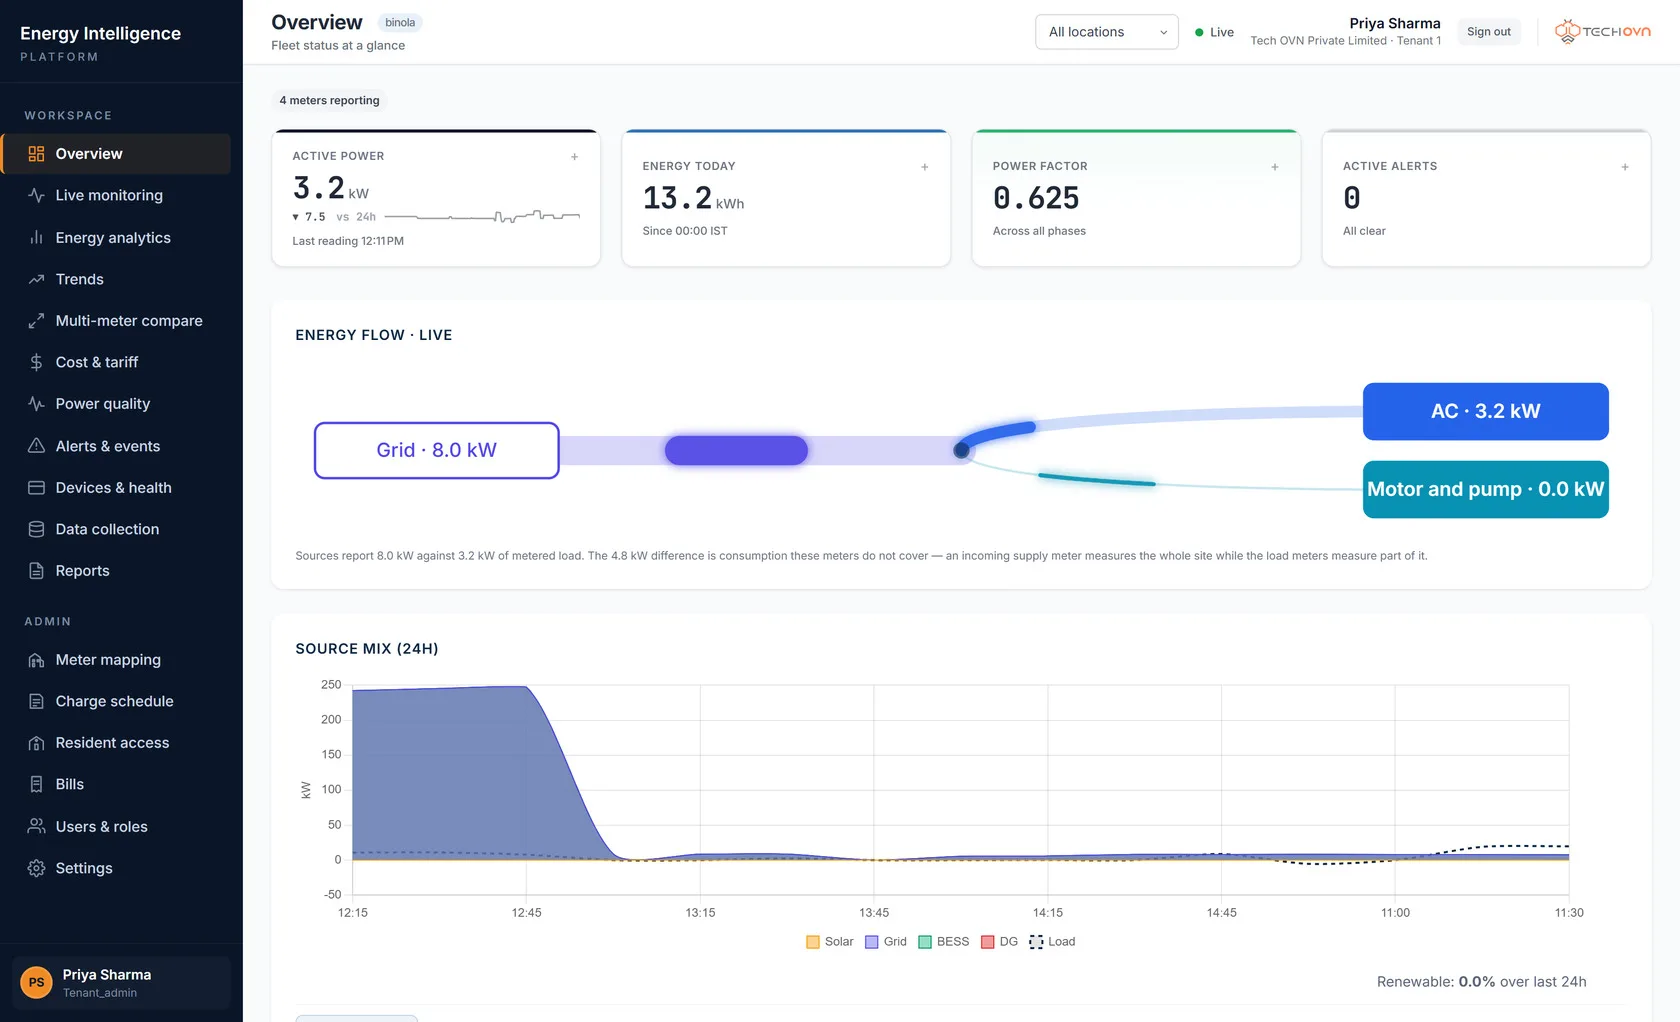
Overview: the whole site in one screen
Four live figures, then the picture behind them: which sources are supplying, which loads are drawing, and how much of the load those meters do not account for.
As the reading arrives
Active power, energy today, power factor and active alerts move as readings arrive from the meter.
Where the power goes
Sources on the left, loads on the right, and the thickness of each line is power.
One site, or all of them
The location filter follows you across every screen.
Live monitoring
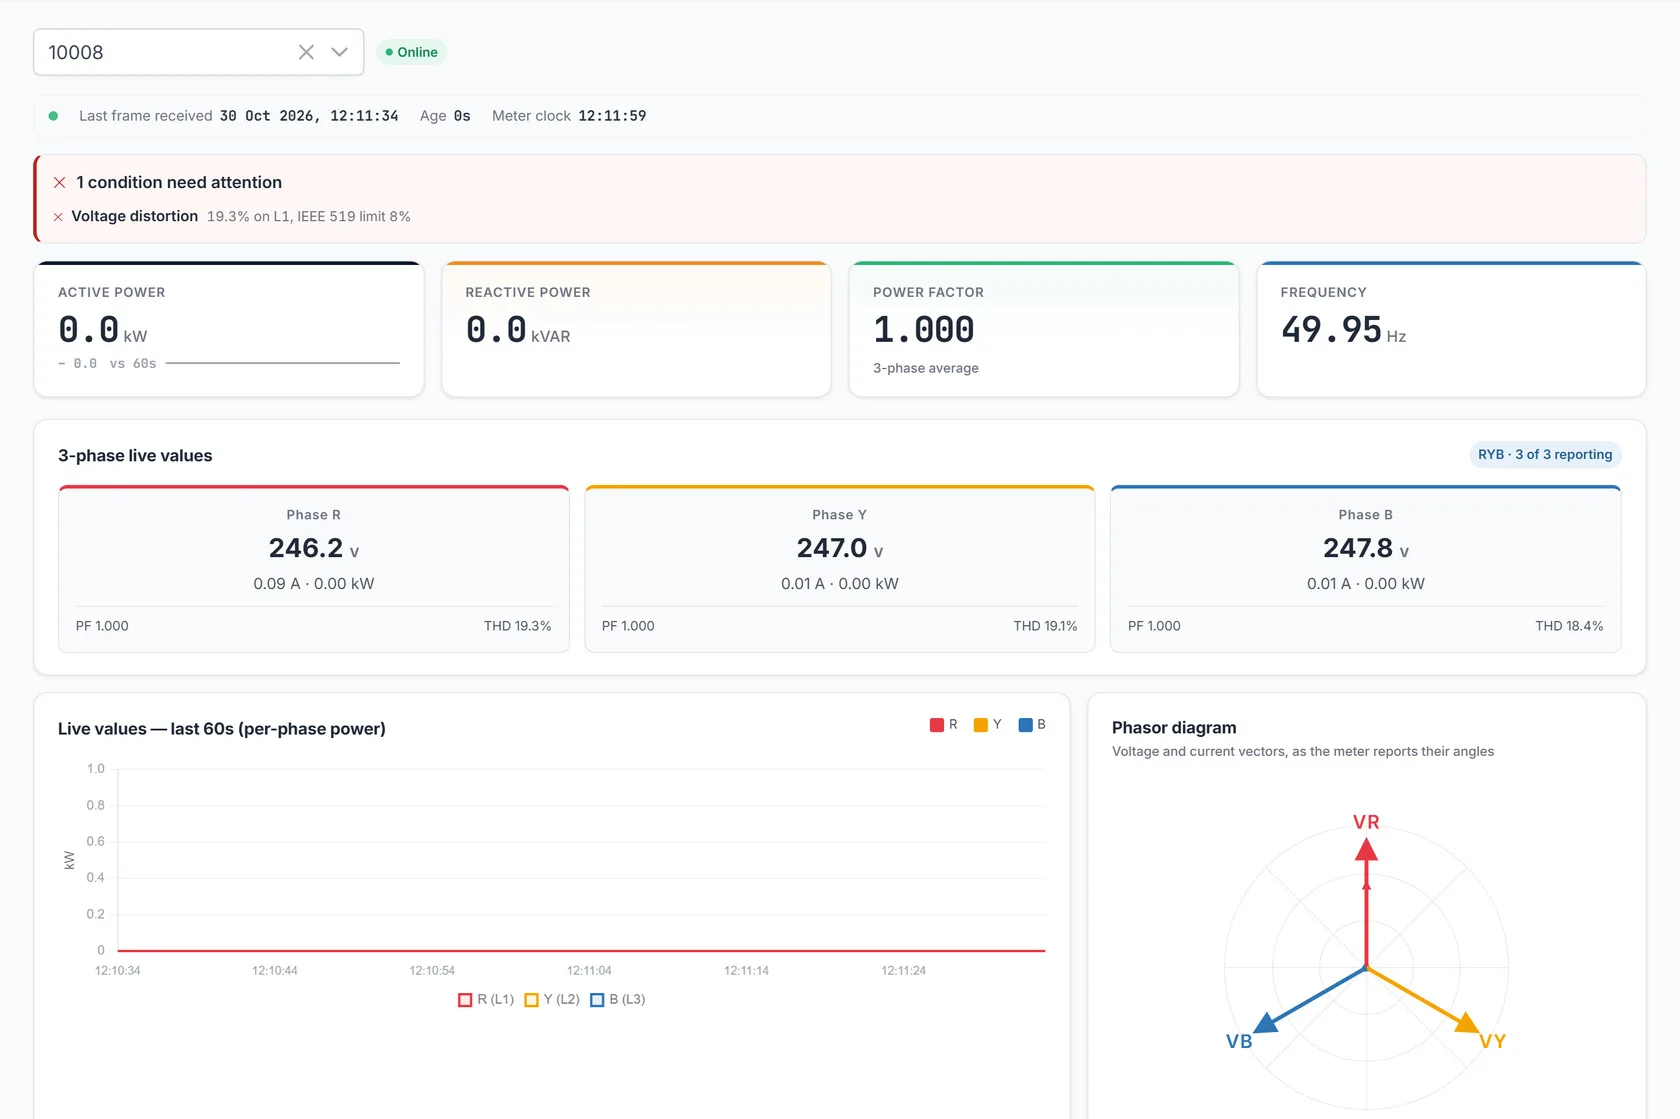
Live monitoring: every phase, as the meter reports it
Voltage, current, power and frequency per phase, refreshed continuously. When one phase drifts, you see which one and by how much. Conditions needing attention are raised at the top of the screen; energy counters, harmonic distortion and a tamper log sit below.
Per-phase values
Voltage, current, power, power factor and voltage THD for R, Y and B, with the age of the last frame received.
Conditions raised first
A reading outside its limit is named at the top with the phase, the value and the limit it broke.
Phasor diagram
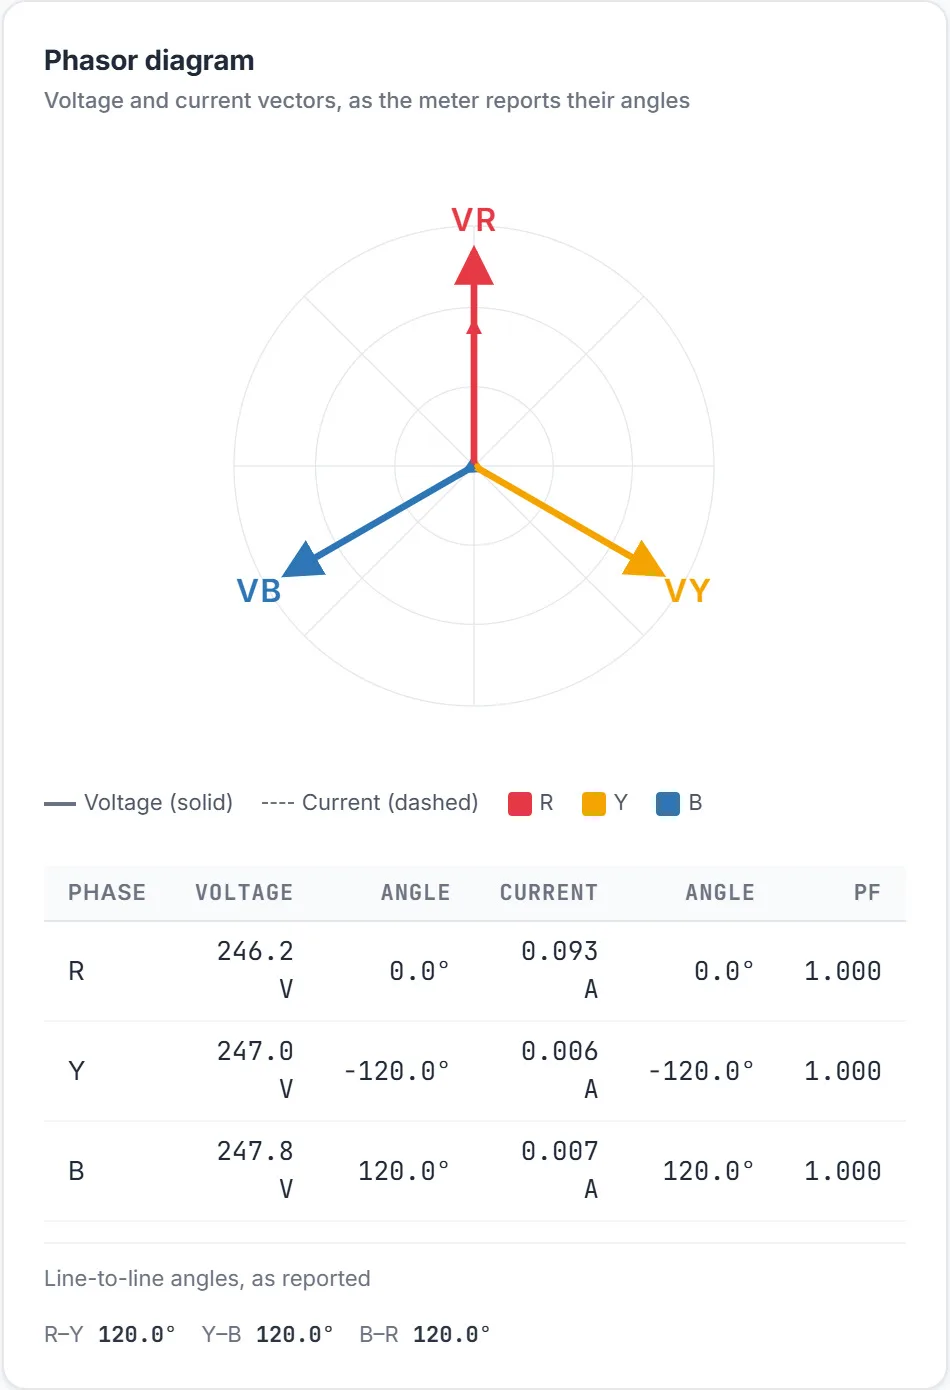
Voltage against current on each phase. A wide angle is a poor power factor; a vector out of place is a wiring fault you can see at a glance.
Devices & health · Meter detail
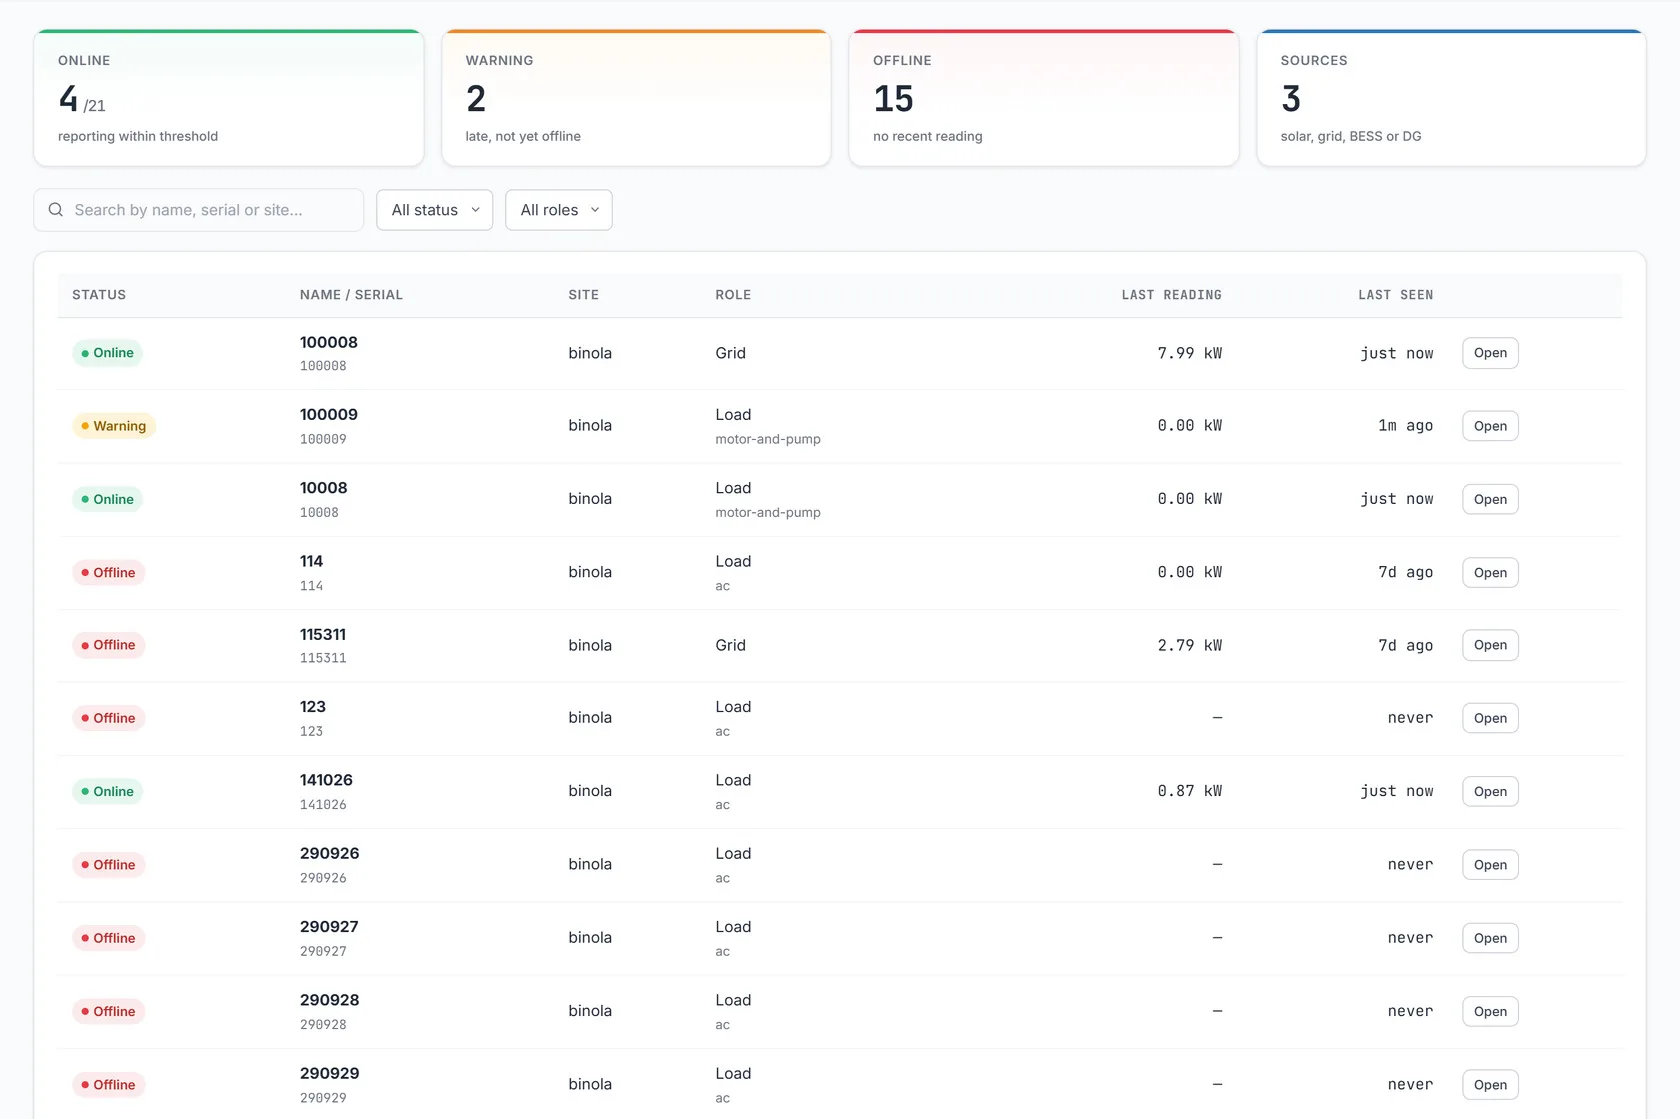
Devices & health: which meter stopped talking, and when
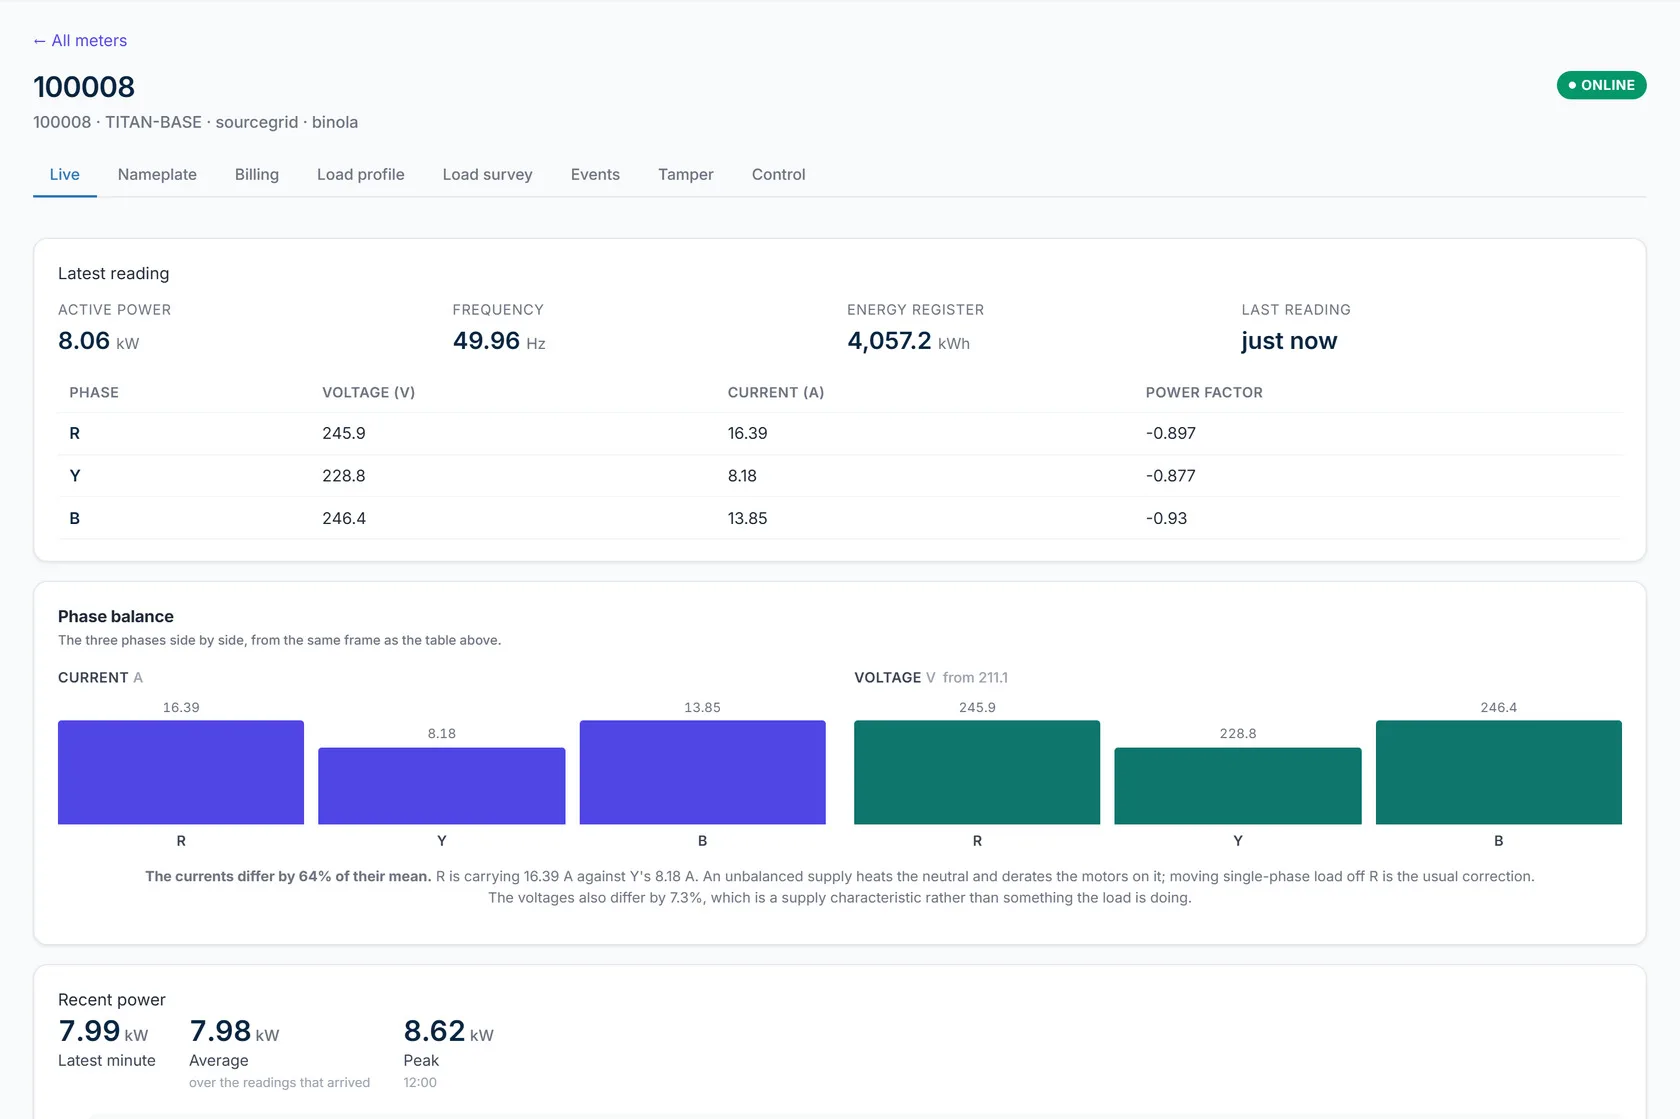
Online, late and offline across the fleet, with the last reading and how long ago each meter was seen. Search by name, serial or site. Open any meter for the full picture: latest reading, phase balance, recent power, and tabs for nameplate, billing registers, load profile, events and tamper.
Three states, not two
Online, warning (late, not yet offline) and offline are counted separately, so a meter that is slipping is visible before it goes quiet.
Last reading and last seen
Each row carries the meter's site, its role (grid source or load), its last reading and when it was last seen.
One meter in full
Meter detail puts the three phases side by side and says in words what the imbalance means.
Energy analytics
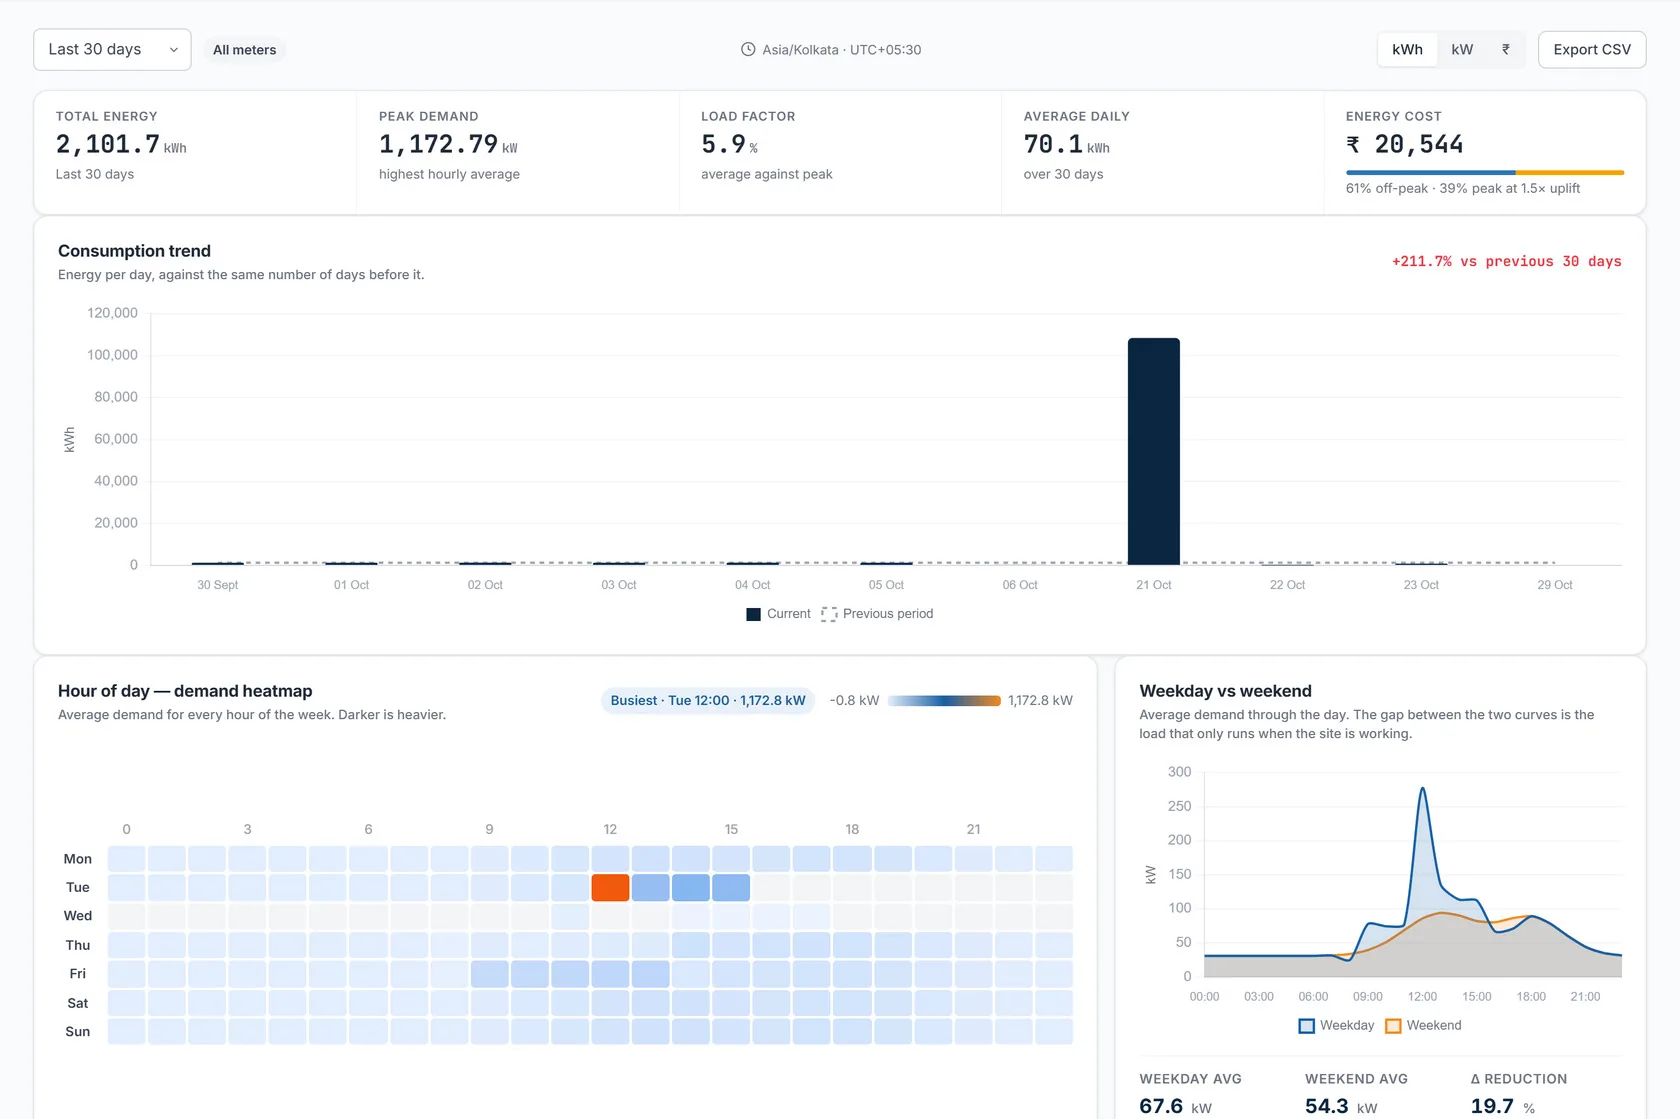
Energy analytics: find the day that cost you money
Total energy, peak demand, load factor and energy cost for the window you choose, then the daily trend, the hours that carry the demand, and the days that sat outside this meter's own normal.
Demand heatmap
Every hour of every day, shaded by load. Patterns show up without reading a table.
Weekday against weekend
A weekend line close to the weekday line means something runs that need not.
Outliers
A statistical range from the meter's own history. Not a forecast.
Trends
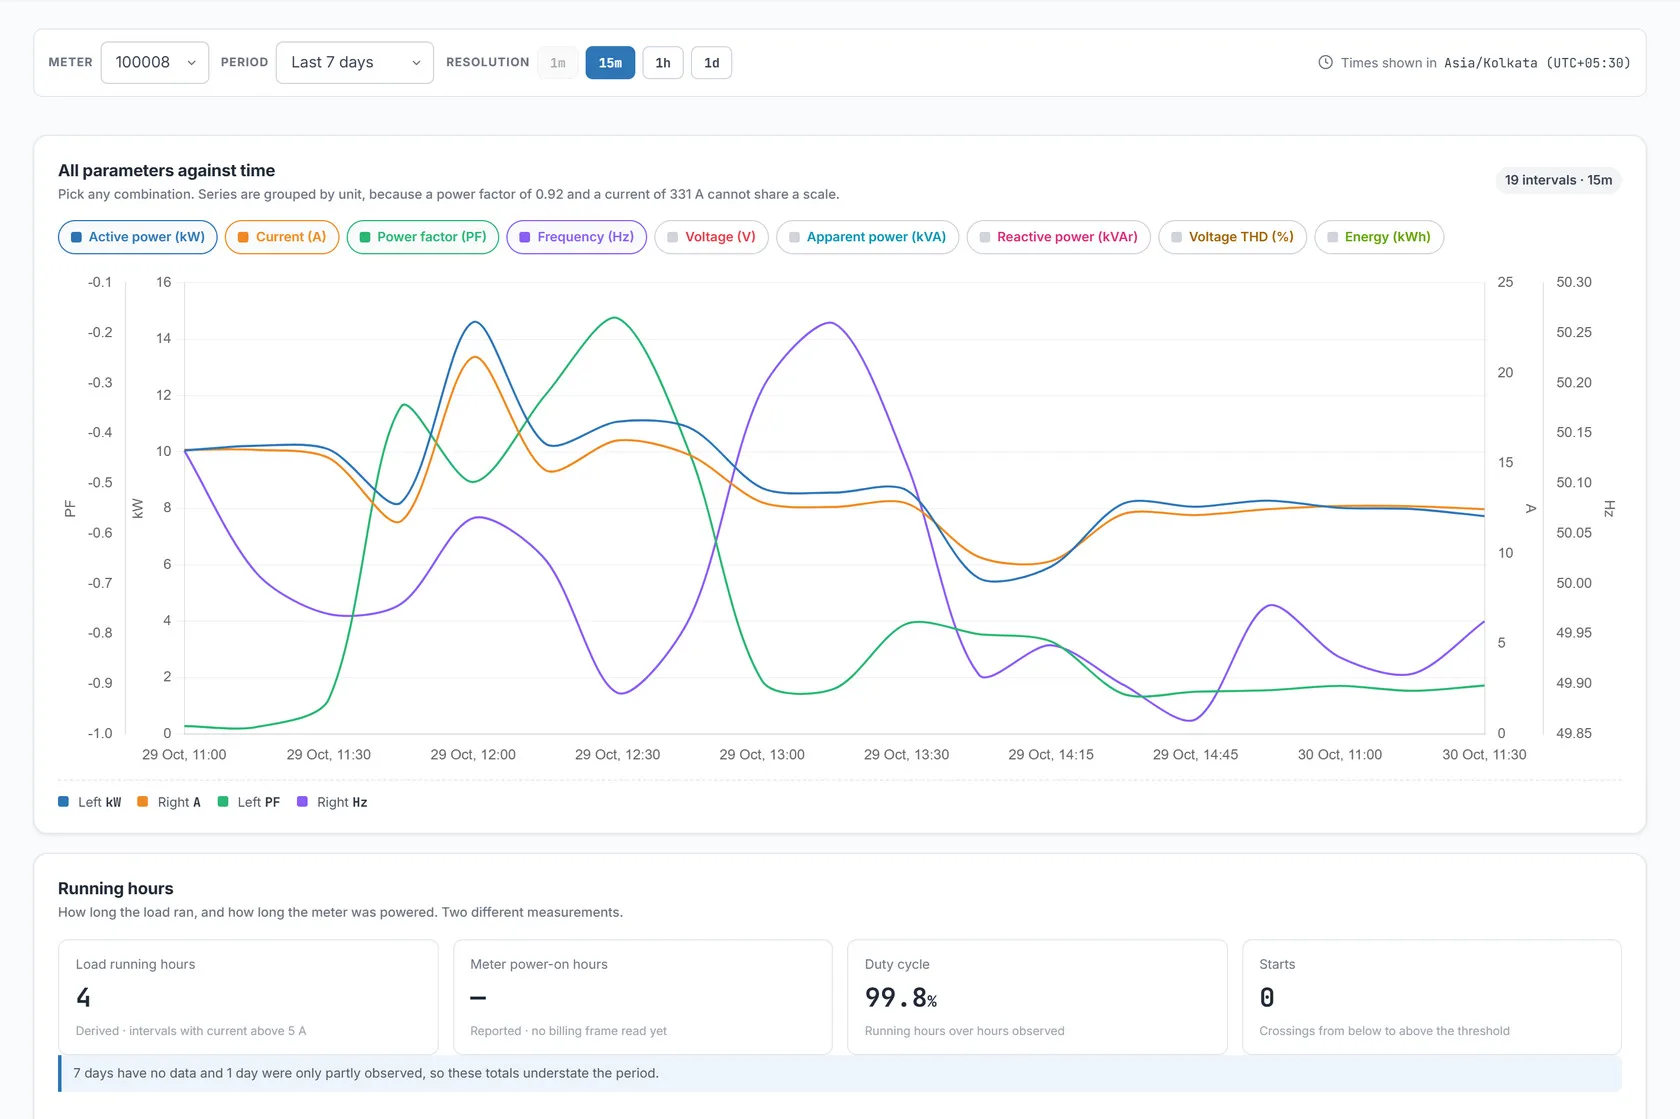
Trends: plot any parameter against any other
The open screen. Choose any measured parameters and put them on one time axis, or scatter one against another to see whether they really move together.
Any combination
Power, current, voltage, frequency and power factor on shared or split axes, grouped by unit.
Your window
Minutes to a year, at the resolution the question needs: 1 minute, 15 minutes, 1 hour or 1 day.
Running hours
How long the load actually ran, beside the chart that shows it.
Multi-meter compare
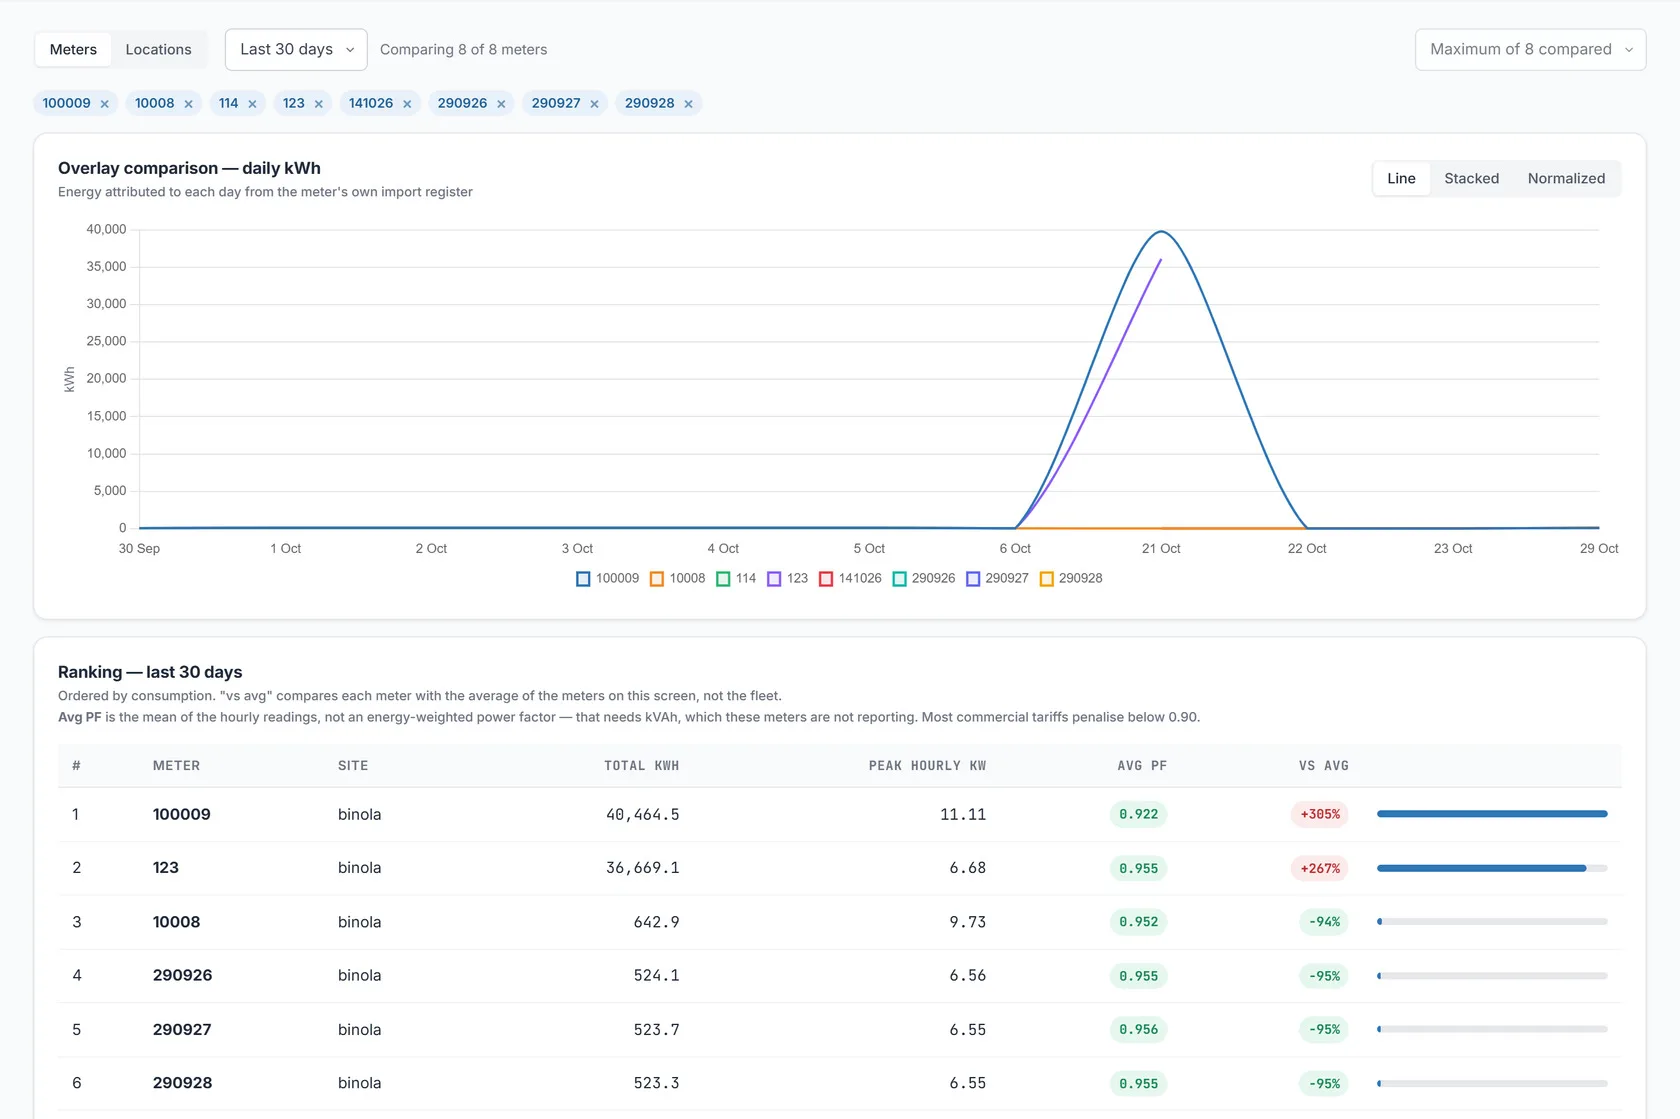
Multi-meter compare: which of these is the expensive one?
Several meters on one axis, which is the only way to tell that one of four similar loads is the problem. Then a ranking that puts a number on it: total energy over the last thirty days, with peak demand, power factor and the change against the previous period.
Overlay, stacked or normalised
Three ways to draw the same meters, depending on what you are asking.
When each meter runs
The hours each meter was drawing load, with its base load, average and peak.
By meter or by location
Compare up to 8 meters at a time, or switch to comparing locations.
Power quality
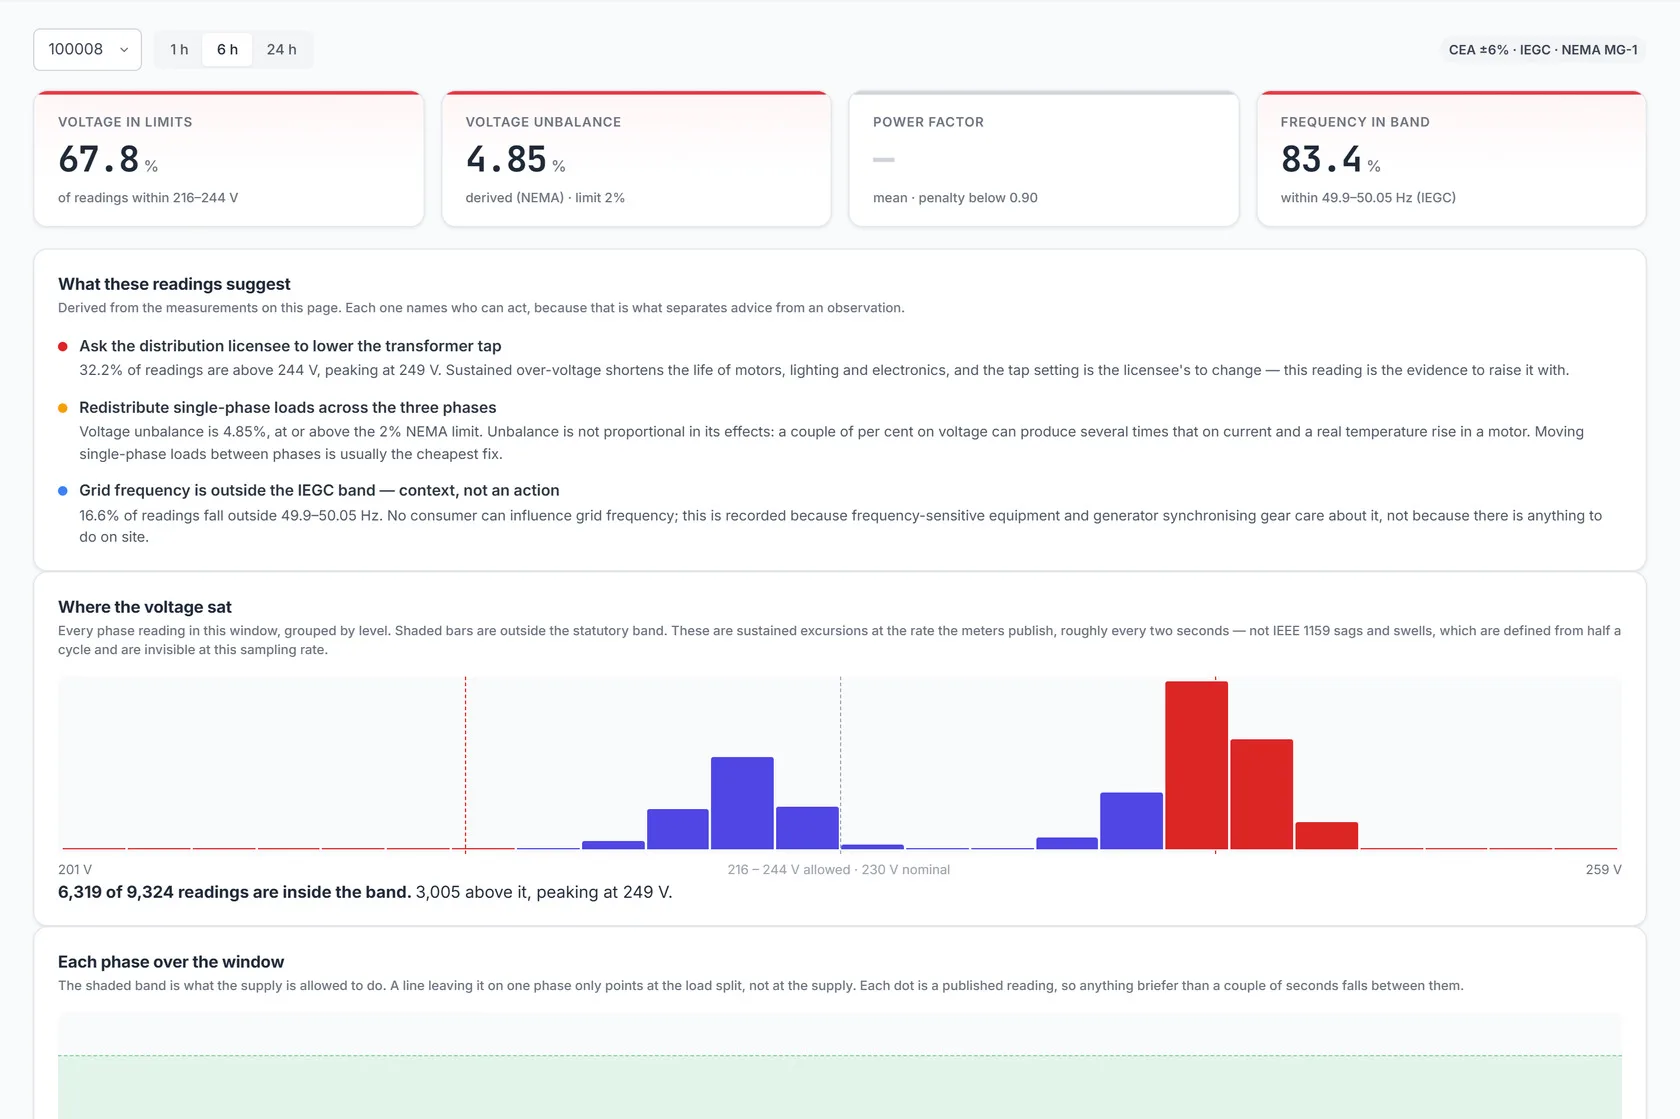
Power quality: proof the supply is within limits
The share of readings inside voltage limits, phase unbalance and frequency in band, with the distribution behind each figure, so a borderline number can be checked rather than taken on trust.
What the readings suggest
Plain-language consequences, each tied to the measurement that produced it and naming who can act on it.
Each phase, separately
Unbalance is a per-phase problem and is shown as one.
Harmonic distortion
As the meter reports it, over the window you selected.
Cost & tariff
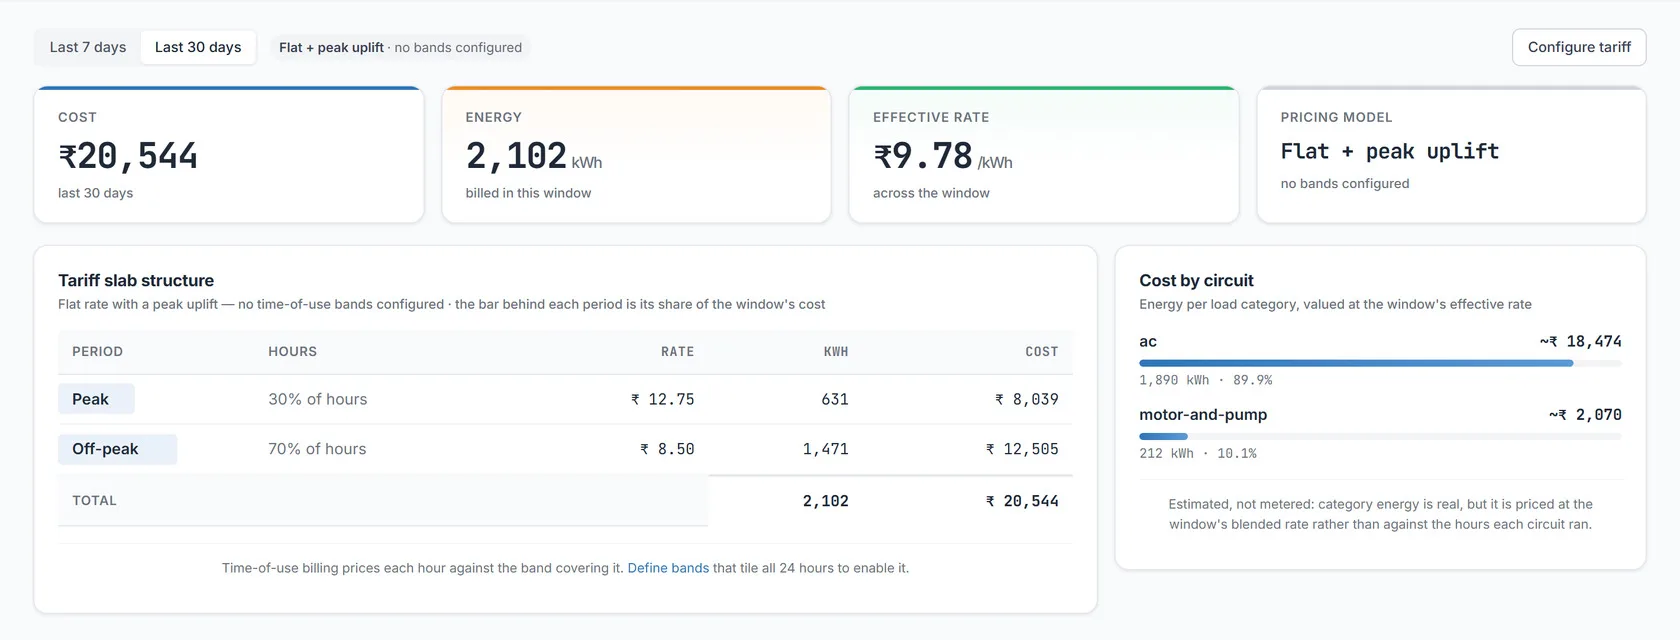
Cost & tariff: every unit priced against your own tariff
Cost, energy and the effective rate for the window, built from the slab structure you configured: peak and off-peak hours, rates and the pricing model, all visible rather than buried.
Your periods and your rates
Peak and off-peak hours, their share of the window, and the rate applied to each, as configured for your site.
Cost by circuit
Which load spent the money, in rupees rather than units. Category cost is shown as apportioned, and labelled as an estimate.
Computed once
The screen, the export and the bill all read the same calculation.
Where the Money Usually Is
Four things an electricity bill will not tell you, and the screens that do. Every one of them is visible on day one, from the meters already on the wall. For the tariff side of each, see how to avoid electricity bill penalties.
Contracted demand
Peak demand set against the load you are sanctioned for, on the Overview panel that carries both. Far under it and you are paying for capacity you never draw.
Maximum demand monitoring →Power factor
Mean power factor against the 0.90 most tariffs penalise below, beside the voltage and unbalance figures from the same window.
Power factor monitoring →Load that runs when you do not
Weekday against weekend, and an hour-of-day heatmap. The gap between the two curves is standing load, the cheapest energy to stop buying.
Energy efficiency →Which circuit spends it
Peak and off-peak hours, the share each took and the rate applied to each, as configured. Category cost is shown as apportioned.
Time-of-day tariff →Alerts & events · Data collection
Alerts and data collection: the evidence underneath
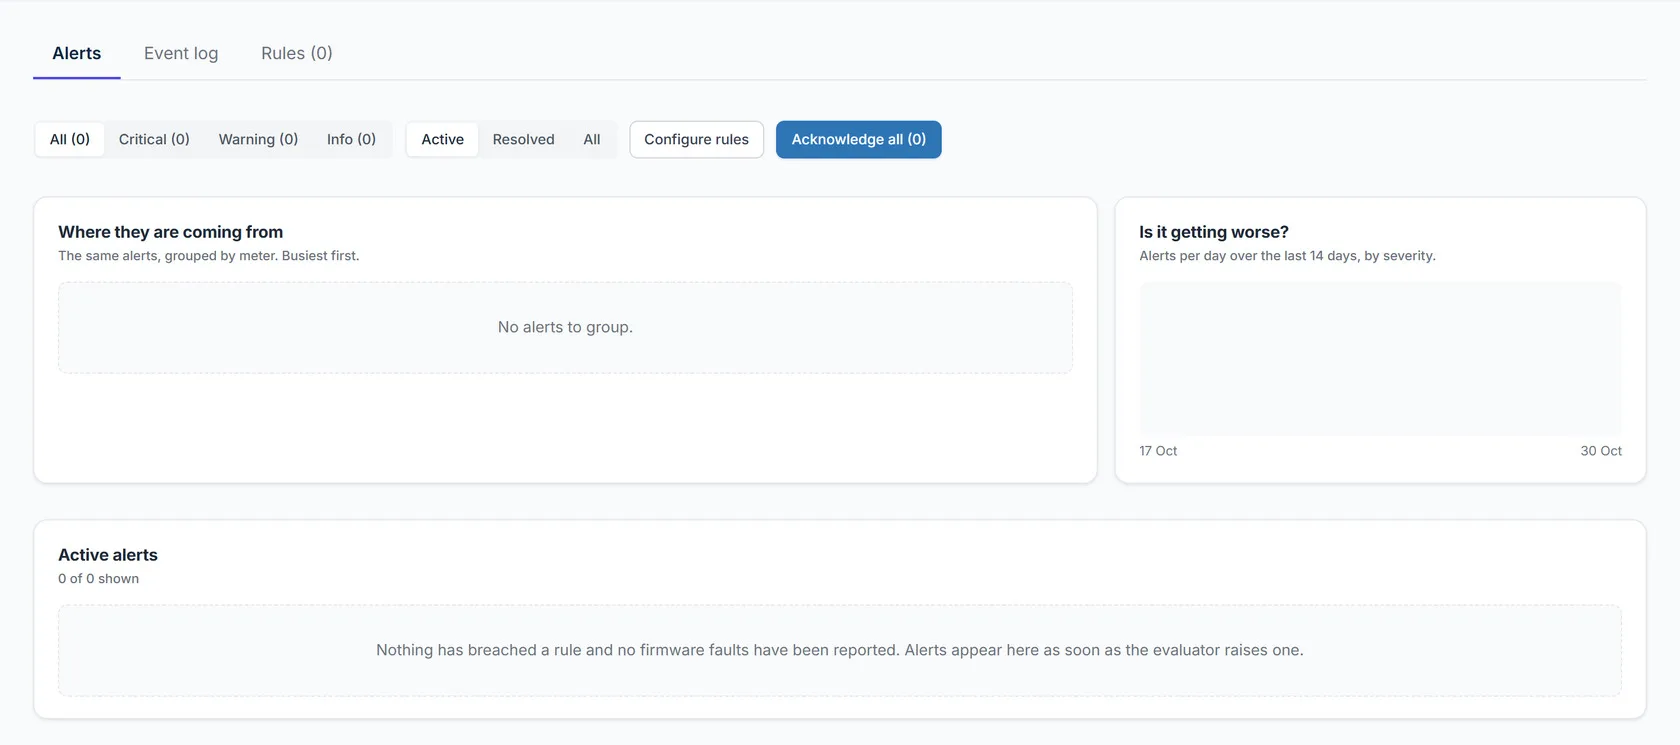
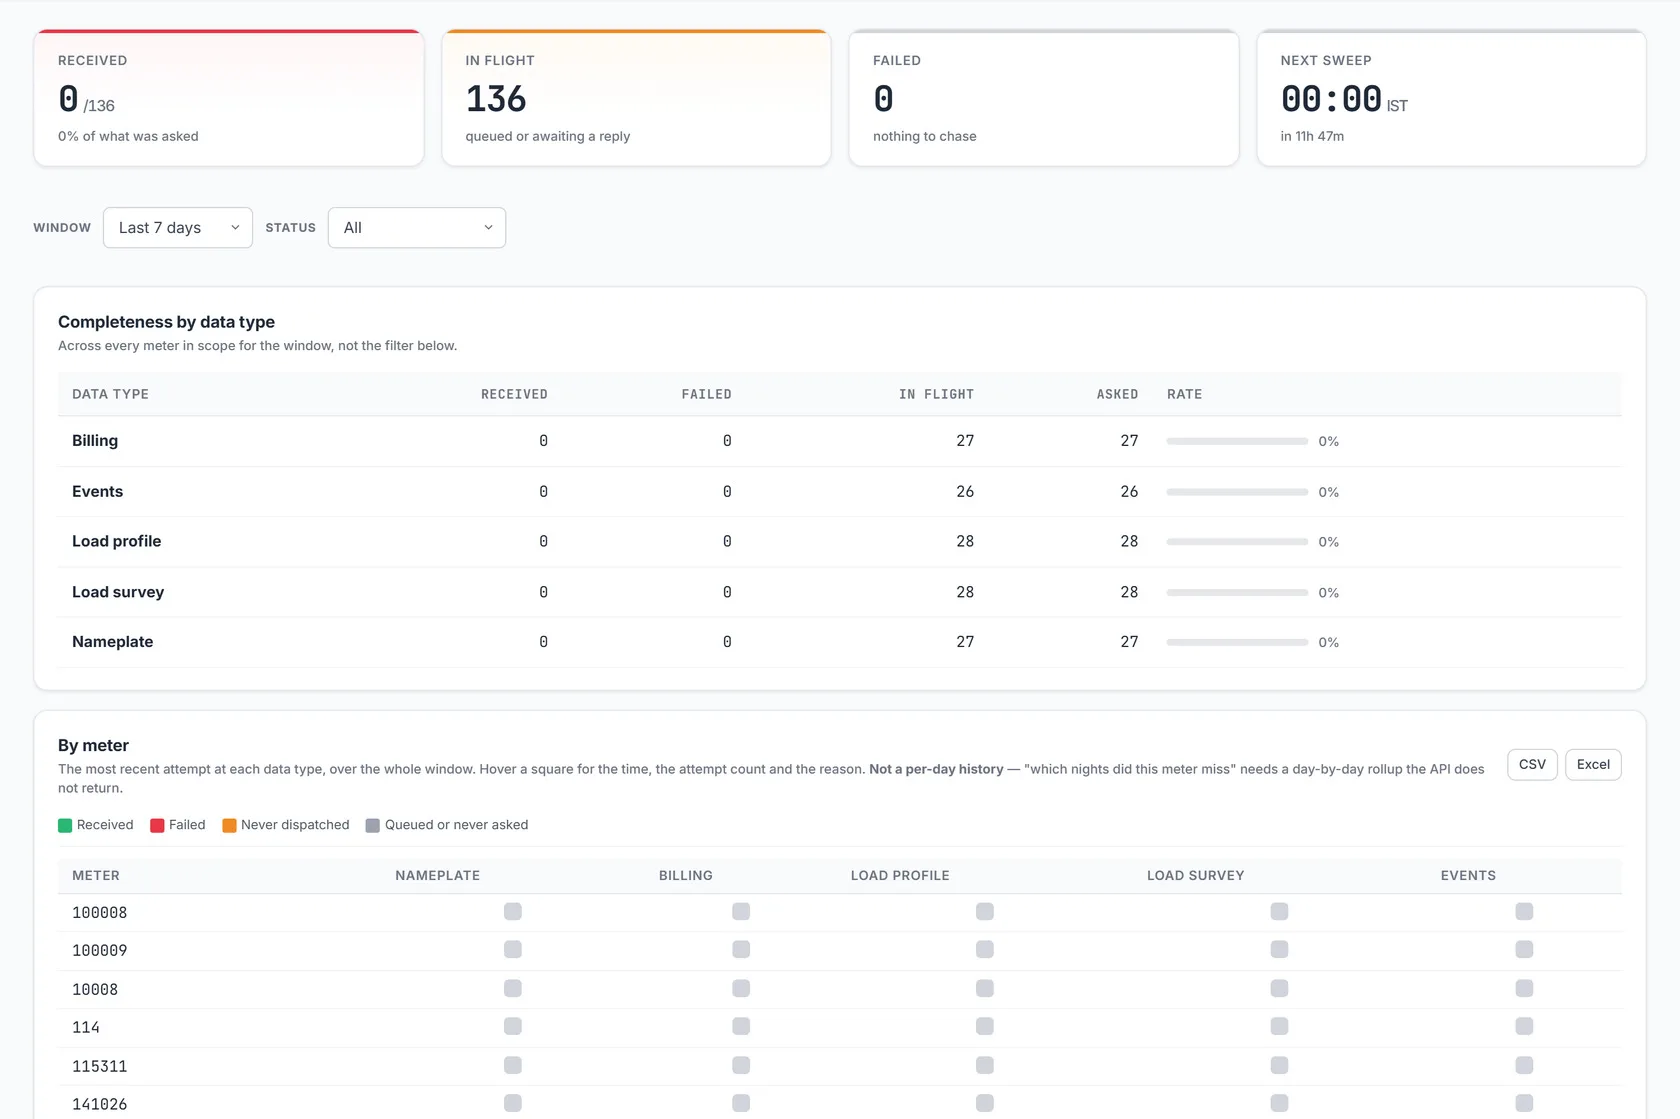
Active alerts, where they are concentrated and whether the rate is worsening, with a full event log and the rules that raise them. Anyone with access can acknowledge. Data collection shows what the nightly sweep asked each meter for and what came back, by data type and by meter. A gap is shown as a gap, never filled in.
Where they are coming from
The same alerts grouped by meter, busiest first, and filtered by critical, warning or info.
Is it getting worse?
Alerts per day over the last 14 days, by severity.
Completeness by data type
Billing, events, load profile, load survey and nameplate: asked, received, failed and still in flight.
Reports
Reports: the same figures, in a file you can send
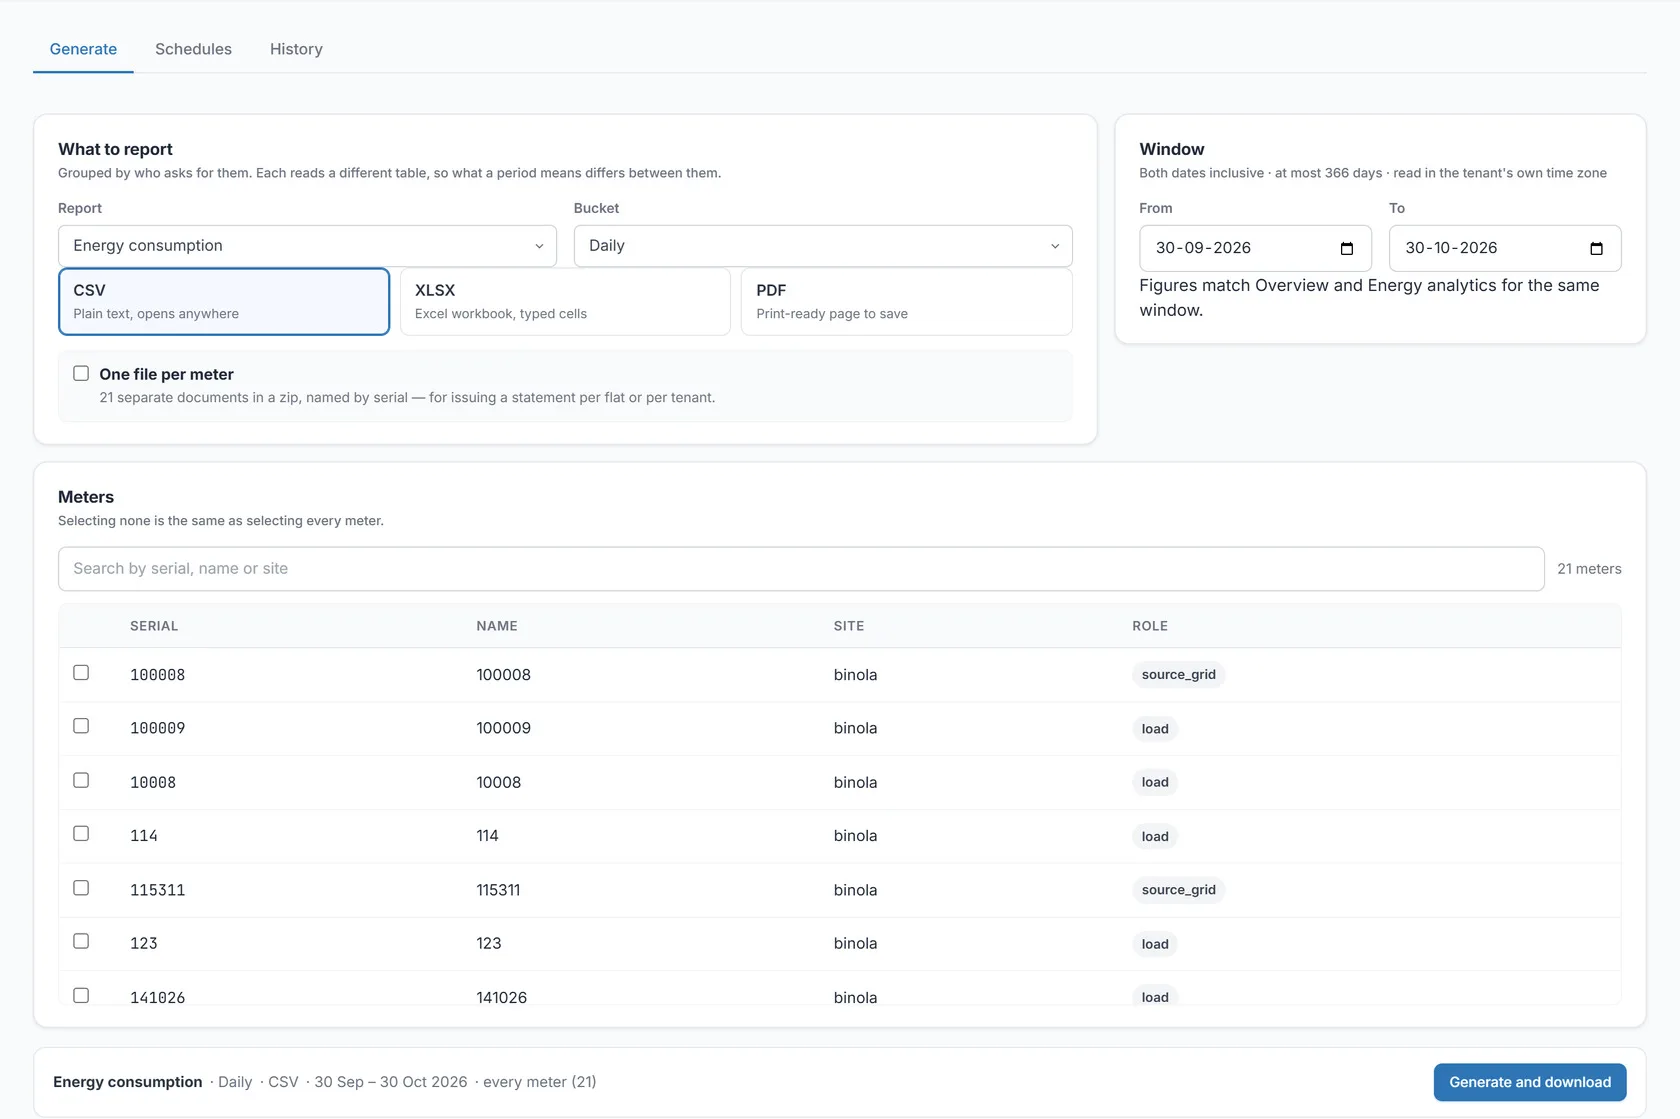
Pick the report, the window and the meters. Take it as CSV, as an Excel workbook or as a print-ready PDF, or schedule it and have it arrive by email. One file for the whole selection, or one per meter. The report carries the figures the screens show, because both are generated from the same calculation on the server.
Three formats
CSV (plain text, opens anywhere), XLSX (Excel workbook, typed cells) and PDF (print-ready page).
Schedules
A Schedules tab for recurring email delivery, and a History tab for what has been run, and when.
One file per meter
Separate documents in a zip, named by serial, for issuing a statement per flat or per tenant.
Users & roles
Users and roles: what each role can actually do
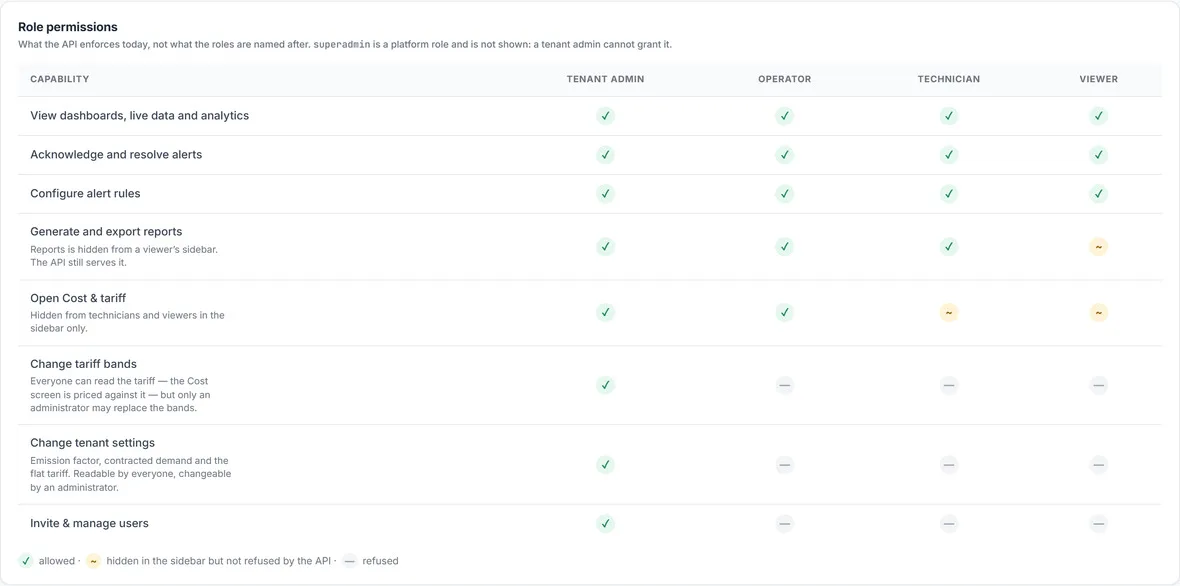
Everyone in the organisation signs in to the same place, and what each person is shown follows their role. Invite colleagues by email and give each one a role. What that role may and may not do is published on the same screen, so nobody finds out by being refused.
What the API enforces
The table lists what the API enforces, which is not always what a role is called.
Hidden, or actually refused
Where a screen is merely hidden from a role, the table says so rather than implying a block.
Invitations expire
Each one can be resent or revoked per person.
Screens shown are the running product against live meters. Figures are from a demonstration environment.
Reading the Graphs: What Each One Tells You to Do
A chart that only describes the past is a report. These are the readings that change a decision, and the action each one points at.
Consumption trend
Energy per day, against the same number of days before it.
What to do
When one day stands clear of the rest, pull that date's shift log and the output that went with it. A spike with no extra production behind it is usually the cheapest thing you will fix all month.
Overlay comparison
Daily energy for several meters drawn on one axis.
What to do
Four similar machines should track together. The one sitting consistently above the others is the maintenance candidate: bearing wear, belt slip, a fouled exchanger, or a motor oversized for its duty.
When each meter runs
The hours each meter was actually drawing load.
What to do
Lay it against the shift pattern the asset is supposed to follow. A machine drawing outside its shift is either being left on or being used off the books, and both are worth a question.
Where the voltage sat
Every phase reading in the window, grouped by level, with the statutory band marked.
What to do
Mass sitting above the band is a transformer tap question for your licensee, and this histogram is the evidence to raise it with. Mass below it points instead at cable sizing or an overloaded incomer.
Hour-of-day demand heatmap
Average demand for every hour of the week. Darker is heavier.
What to do
Move a deferrable load (pumping, batch heating, charging) out of the darkest block. Where billed demand is set by the worst half-hour, staggering two large starts can cut the figure on its own.
Energy by category
The share each kind of load took over the window.
What to do
Audit the largest share first. A ninety-ten split tells you where not to spend an engineer's week as clearly as it tells you where to.
Weekday against weekend
Average demand through the day, split by whether the site was working.
What to do
The weekend line is what runs when nobody is there. Walk it down: compressors cycling on leaks, chillers with no night setback, lighting and standby panels.
Days outside the usual range
Each day against two standard deviations either side of its own day-type average.
What to do
Treat it as a shortlist, not an alarm. Check the flagged days against production volume and ambient temperature before you conclude anything from them.
Phasor diagram
The angle between voltage and current on each phase.
What to do
A wide angle on all three phases is a power factor worth correcting. One vector out of place is a wiring or CT polarity error; fix that before trusting any other reading on the meter.
BESS Sizing and CO₂ Reporting
Two more things the platform works out from the readings your Titan meters already send.
BESS sizing and ROI
The platform sizes a battery energy storage system (BESS) and projects its return from your actual load profile, as your Titan meters recorded it, not from a sales estimate.
- Load profile analysis
- Solar surplus windows
- Recommended capacity
- Scenario comparison
- Tariff sensitivity analysis
CO₂ reporting
CO₂ emissions are calculated from metered energy. Each source carries its own emission factor, and the grid factor is configurable per utility.
- Per source: grid, diesel generator and solar
- Configurable grid emission factors
- Per meter, per site and across the portfolio
Pricing and Trial
The Energy Intelligence Platform costs ₹120 per meter per month, plus GST. The minimum subscription is 1 year. The 1-week free trial runs on your own Titan meter (you buy the meter first, then test the platform on your own data) or on a demo login with sample data.
| Platform subscription | ₹120 per meter per month, plus GST |
|---|---|
| Minimum term | 1-year subscription |
| Free trial | 1 week, on your own Titan meter (bought first) or on a demo login with sample data |
| Worked example | 10 meters: ₹1,200 per month, ₹14,400 for the first year, plus GST |
| Meters | Priced separately. Titan 3-phase meter ₹11,000 + GST, CTs extra |
| Without the platform | A Titan meter also works standalone over Modbus, MQTT or BACnet into your own system, at no ongoing cost |
Platform at a Glance
| Parameter | Specification |
|---|---|
| Product | Tech OVN Energy Intelligence Platform: cloud energy management system software, used in a web browser |
| Screens | Overview, Live monitoring, Devices & health, Meter detail, Energy analytics, Trends, Multi-meter compare, Power quality, Cost & tariff, Alerts & events, Data collection, Reports, Users & roles, Settings, Organisations |
| Meters | Tech OVN Titan 3-phase meters only, reporting over MQTT on built-in WiFi or Ethernet with no gateway. Meters from other manufacturers are not supported |
| Live data | Per-phase voltage, current, power, power factor, frequency and voltage THD; meters publish roughly every two seconds |
| Trend resolution | 1 minute, 15 minutes, 1 hour or 1 day, over windows from minutes to a year |
| Comparison | Up to 8 meters at once, as overlay, stacked or normalised charts, with a 30-day ranking |
| Power quality limits checked | Voltage 216–244 V (230 V ±6%), voltage unbalance 2% (NEMA MG-1), frequency 49.9–50.05 Hz (IEGC), power factor 0.90 |
| Cost | Your own tariff: peak and off-peak hours and rates, effective rate per kWh, cost by circuit |
| BESS sizing | Battery sizing and ROI projection from your actual load profile: load profile analysis, solar surplus windows, recommended capacity, scenario comparison, tariff sensitivity |
| CO₂ reporting | CO₂ per source (grid, DG, solar) with configurable grid emission factors; per meter, per site and across the portfolio |
| Reports | CSV, Excel (XLSX) and PDF; on demand or scheduled by email; one file for the selection or one per meter; windows up to 366 days |
| Roles | Tenant admin, operator, technician and viewer, with the permissions of each published in the product |
| Price | ₹120 per meter per month + GST; minimum 1-year subscription; 1-week free trial |
EMS by Type of Site
The platform is the same on every site. What changes is what you put a meter on and which screens you open first.
EMS for Factories
Put a meter on each line or large machine and use Multi-meter compare to find the one of four similar loads that sits above the rest. Lay When each meter runs against the shift pattern, and use the demand heatmap to move deferrable load out of the worst half-hour.
Energy metering for factories →EMS for Commercial Buildings
Meter each tenant, floor or riser. The weekday-against-weekend curve shows what runs when the building is empty, Cost & tariff prices each circuit against your tariff, and Reports can issue one file per meter for a statement per flat or per tenant.
Building energy monitoring →EMS for Data Centres
The Overview energy-flow diagram sets what the sources supply against what the load meters account for. Power quality keeps the share of readings inside voltage and frequency limits on record, and Devices & health shows a silent meter before the data gap matters.
Energy metering for data centres →EMS for Hospitals
Meter critical feeders separately and watch them on Live monitoring, where a condition outside its limit is raised at the top of the screen. Power quality records voltage, unbalance and frequency against their limits, and the source mix shows grid and DG supply over the last 24 hours.
Energy monitoring for hospitals and campuses →Not sure how this differs from your existing BMS or SCADA? Read the EMS vs BMS vs SCADA comparison guide.
Frequently Asked Questions
Cost, minimum term, the free trial, data export, which meters work, BESS sizing, CO₂ reporting and user roles.
Next step: try the platform for a week
₹120 per meter per month + GST, minimum 1-year subscription. The 1-week free trial runs on your own Titan meter or on a demo login with sample data.