Solution
District Cooling Monitoring — COP, BTU & Predictive Maintenance
One device, both sides of the chiller.
A district cooling system produces chilled water at a central plant and distributes it to multiple buildings or tenants, who pay for thermal energy consumed. District cooling monitoring measures that thermal output alongside the chillers' electrical input to track COP and kW/TR. Tech OVN's Titan Plus BTU does both on one device, with EN 1434 Class 2 thermal metering.
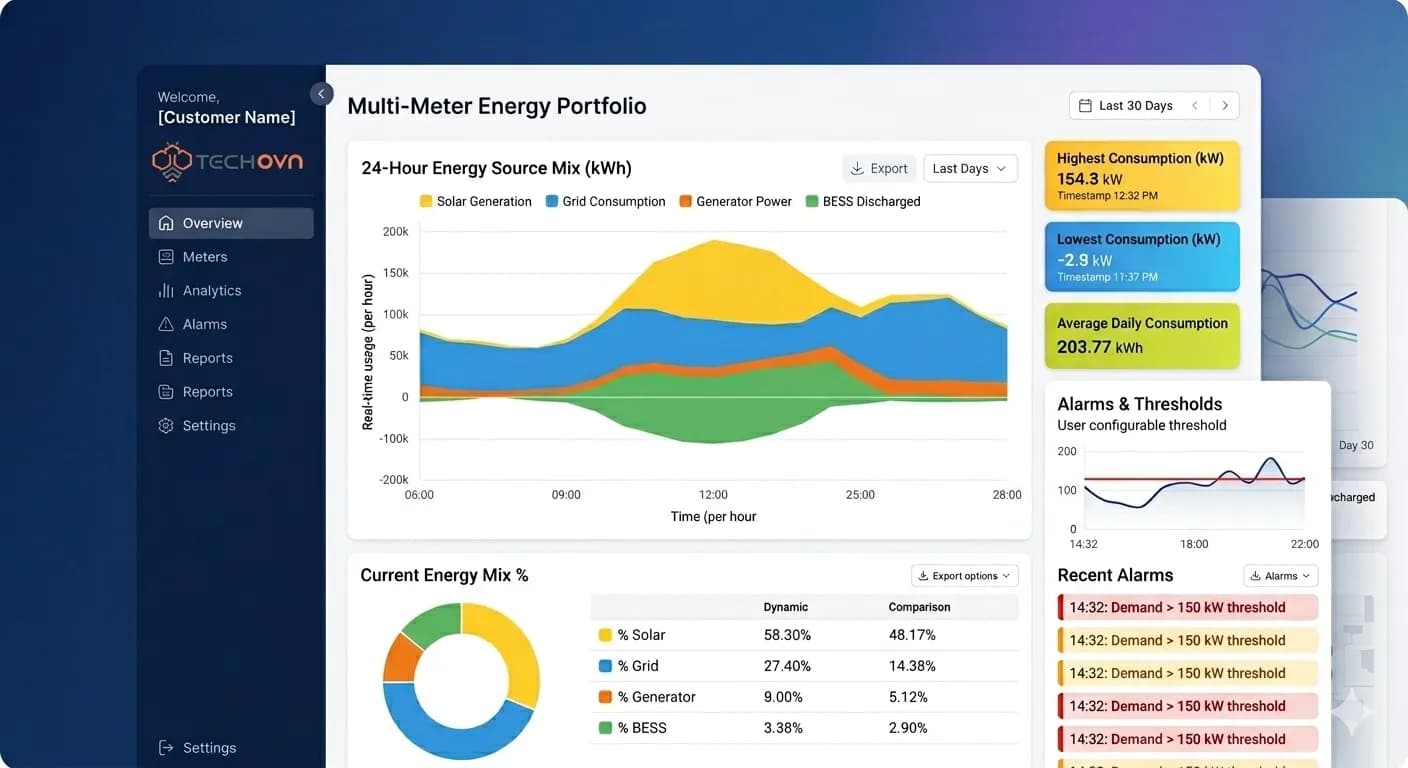
Combined electrical + thermal metering on every chiller, with live COP, kW/TR trending, and predictive-maintenance alerts. Titan Plus BTU timestamps both measurements on the same chip — so COP is an engineering metric, not an estimate — and the Energy Intelligence Platform turns the data into tenant billing, efficiency drift alerts, and LEED / IGBC-ready M&V.
The District Cooling Efficiency Problem
Every district cooling commissioning report has a COP number on page one. Then the meter gets forgotten. Condenser tubes foul, chilled-water setpoints drift, coil fouling pushes distribution ΔT below design, and by year three the plant is running 15% worse than day one — but nobody's measuring.
Across a 10,000 TR DCS, every 0.1 COP point is roughly ₹40 lakh per year in avoidable electricity cost. Across a portfolio of plants, the annualised loss compounds fast. The fix is simple: measure continuously, not just at commissioning — and measure both sides of the chiller on the same timebase so COP is a clean, defensible metric.
That's what Titan Plus BTU + the Energy Intelligence Platform does — in a single stack, with no third-party gateway in between.
What District Cooling Monitoring Delivers
Six capabilities that separate an engineering-grade district cooling monitoring stack from BMS energy modules.
Combined Electrical + Thermal Metering
Titan Plus BTU measures chilled-water flow, supply/return ΔT, and the chiller's electrical input on a single DIN-rail device — synchronous measurement on the same timebase, so COP is a real number rather than the average of two mismatched readings.
Live COP & kW/TR Trending
The Energy Intelligence Platform shows chiller and plant-level COP continuously, not just at commissioning. Alerts fire when COP drops more than 5% below baseline — often catching condenser fouling or CHW setpoint drift weeks before they show up on the bill.
Predictive Maintenance on Chillers
Compressor current signature, harmonics, vibration, and bearing temperature (via Titan Asset) surface degradation patterns months before failure. Plan maintenance rather than respond to it.
Tenant-Grade BTU Billing
EN 1434 Class 2 meters on each tenant connection deliver auditable kWh-thermal consumption and defensible monthly invoices. Matched Pt500 temperature probes, tamper detection, and remote reads.
Multi-Chiller Sequencing Analysis
For plants with 2+ chillers, the platform identifies which sequencing strategy minimises combined plant energy — often uncovering 5–10% savings through better staging or free-cooling economiser use.
Low-ΔT Syndrome Detection
The #1 silent killer in DCS operations: distribution ΔT collapses below design, pumping energy doubles. Continuous ΔT monitoring flags the problem days after it starts, not seasons later.
The Integrated Stack
Three products, one platform — purpose-built for district cooling plants and large chiller installations.
Titan Plus BTU
Combined electrical + BTU meter in one DIN module. Measures both sides of the chiller (thermal output + electrical input) with guaranteed synchronous timestamps — so computed COP is accurate.
Titan Asset
Condition monitoring add-on for chillers and cooling-tower pumps/fans. Vibration, temperature, and harmonic signature analysis via Titan's RS485 expansion.
Energy Intelligence Platform
Cloud dashboard: per-chiller and plant-level COP, kW/TR, tenant billing, multi-site portfolio view. Configurable alerts, PDF reports, API access.
Who this is for
Four operator archetypes deploying integrated chiller-plant monitoring today.
District Cooling Scheme Operators
10,000+ TR central plants supplying office parks, mixed-use townships, or campus developments. The 0.1 COP delta across the plant = ₹40+ lakh/year at this scale.
Large Commercial Chiller Plants
Office buildings, IT parks, hotels, hospitals with 500–3000 TR chiller plants running 12+ hours/day.
LEED / IGBC-Rated Buildings
Ongoing M&V required for Platinum-level energy performance re-certification. Continuous COP logs with timestamps — not just commissioning snapshots — satisfy the M&V rigor auditors expect.
Energy Service Companies (ESCOs)
Performance-contract M&V on chiller-plant retrofits. Same hardware that built the baseline now proves the savings month-on-month.
Worked example — 1,500 TR DCS
A 1,500 TR district cooling plant serving a mixed-use office campus, 2 × 750 TR centrifugal chillers, design COP 6.1, running 10 hours/day × 250 days/year.
- Commissioned at COP 6.0 (0.59 kW/TR). Annual electricity cost at design: ~₹2.6 crore.
- Year 2: condenser fouling + CHW setpoint drift → average COP drops to 5.3 (0.66 kW/TR). Without monitoring, nobody notices until the invoice comes in.
- With Titan Plus BTU + the platform: COP-drift alert at week 6 of year 2. Cleaning + setpoint re-optimisation restores COP to 5.9 within a month.
- Savings captured: ~₹22 lakh in that year alone. Plus one avoided compressor rebuild (caught via Titan Asset vibration signature shift) — typically ₹15–25 lakh.
Frequently asked questions
Eight common questions on district cooling measurement, COP, and predictive maintenance.
Related products & tools
The integrated measurement stack behind chiller-plant optimisation.
Titan Plus BTU
Combined BTU + electrical meter on a single DIN module. Synchronous measurement, live COP, EN 1434 Class 2.
Learn More →BTU Meter Sizing Calculator
Work out the right BTU meter for your chilled-water loop — flow, ΔT, and accuracy class.
Learn More →Chiller COP Calculator
Derive COP, kW/TR, EER, and IPLV from your measurements, benchmarked to ECBC 2017 and ASHRAE 90.1.
Learn More →AI Condition Monitoring
Predictive maintenance on chiller compressors, pumps, and cooling-tower fans via Titan Asset.
Learn More →Energy Intelligence Platform
Cloud dashboard with portfolio view, COP trending, tenant billing, and LEED / IGBC M&V exports.
Learn More →Plan a chiller-plant monitoring deployment
Share your plant size, chiller count, and current M&V setup. We return a BOQ including Titan Plus BTU, condition monitoring, and the platform subscription in 48 hours.