
Solution
Industrial Energy Monitoring System
Every Motor. Every Line. Every Shift.
An industrial energy monitoring system measures electricity circuit by circuit across a plant, metering each motor feeder, production line and shared utility separately rather than as one site total. Tech OVN fits Titan Class 0.5S DIN rail meters on each feeder, measuring kWh, kVAh, power factor and maximum demand, from ₹8,500 per measurement point with no catalogue MOQ.
A complete energy monitoring system for factories, process plants and heavy industry, combining Titan Class 0.5S DIN rail meters with our cloud-based Energy Management System (EMS). Monitor every feeder in real time, tie kWh to production output, catch demand and power-factor penalties before they bill, and report CO₂ — across one plant or a group of them. Monitoring an office, mall, hotel or campus instead? Use building energy monitoring, which is built around HVAC-dominated loads and tenant supplies.
Why a Plant Total Tells You Nothing
Most factories monitor energy at the utility meter — a single number for the whole site. That's like running a business with one bank balance and no ledger. You know the total, but you cannot attribute it, so you cannot act on it. When the bill rises 8% you have no way to tell whether it was the new compressor, a failing motor, a shift pattern change, or the tariff.
Industrial loads make this worse than it sounds. A manufacturing plant's consumption is dominated by motors, and motors do not fail politely — they draw more current for months first. A compressor running 4% less efficiently than at commissioning costs real money every hour it runs, and no site-level meter will ever show it to you. Nor will it show you that your maximum demand peak is set by two machines starting within the same 15-minute window, which is the cheapest penalty on an Indian industrial tariff to design out.
Tech OVN's industrial energy monitoring system puts a Class 0.5S meter on every distribution board and every major motor feeder — circuit-level measurement that turns energy from an overhead line item into a cost you can attribute, forecast and reduce.
Real-Time Power Monitoring System Capabilities
Six capabilities that matter on a plant floor, where the loads are motors and the penalties are demand and power factor.
Real-Time Energy Monitoring
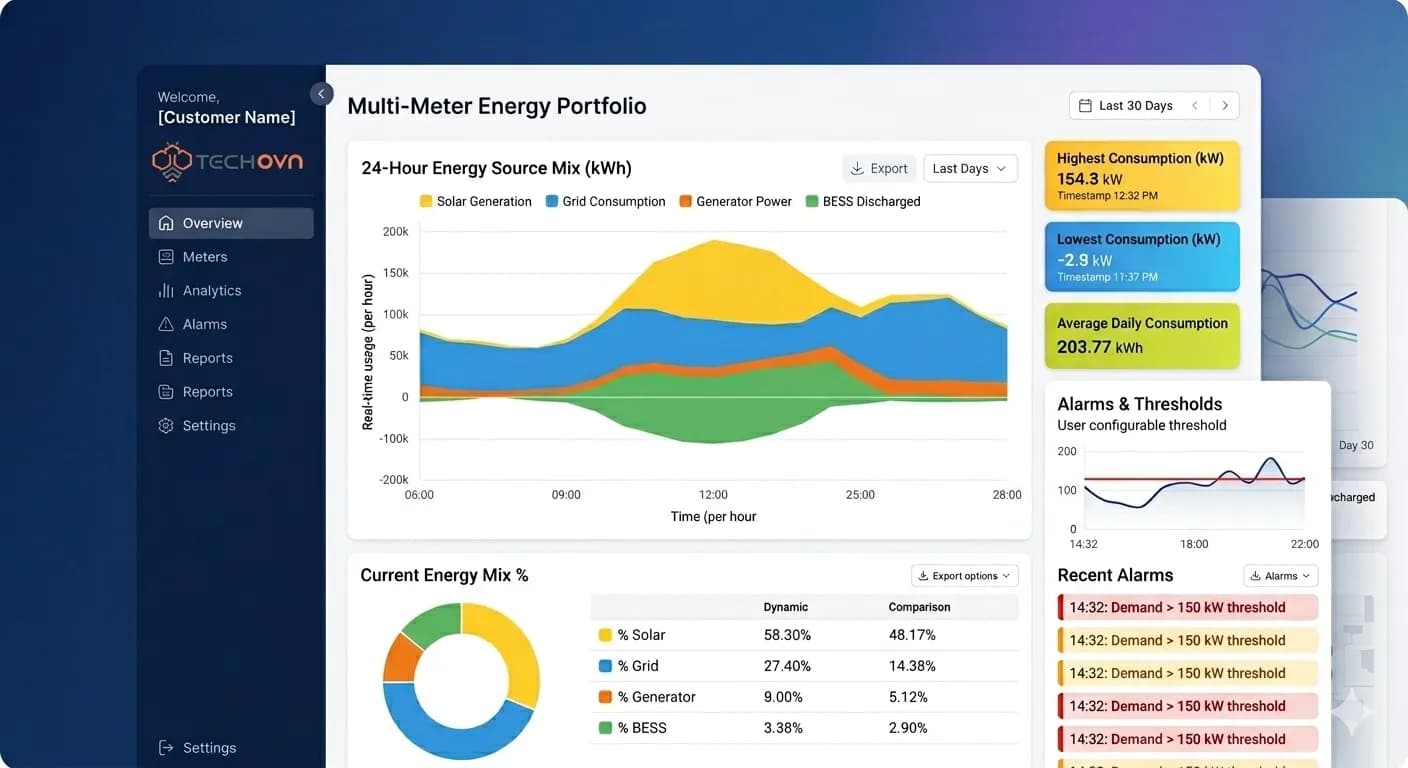
Live dashboards showing voltage, current, power, energy, power factor, and harmonics across every monitored circuit. Updates every measurement cycle — not every 15 minutes.
Consumption Analytics
Automatic load profiling, time-of-use breakdown, demand trending, and anomaly detection. The platform identifies waste patterns that spreadsheets miss.
Multi-Site Visibility
Monitor factories, warehouses, offices, and retail locations from a single dashboard. Compare consumption across sites, normalise for weather, and benchmark performance.
Alerting & Automation
Configurable thresholds for demand, power factor, voltage, and runtime. Alerts via email or webhook. Autonomous relay control for load shedding when limits are exceeded.
Cost Allocation
Assign energy costs to departments, production lines, or tenants. TOU registers and demand profiles feed directly into billing and cost-centre reports.
CO₂ & ESG Reporting
On-device CO₂ calculation using configurable grid emission factors. Scope 2 data ready for CSRD, BRSR, and GHG Protocol reporting without manual spreadsheet work.
How It Works
Three components, one integrated energy monitoring solution.
Titan Meters on Every Circuit
Class 0.5S DIN rail smart energy meters installed at each distribution panel. WiFi, Ethernet, or RS485 connectivity. No gateway hardware needed.
Energy Intelligence Platform
Cloud-based analytics layer that aggregates data from all Titan meters. Live dashboards, historical trends, automated reports, and anomaly detection.
Titan App
Commission meters from your phone, view live data, generate PDF reports on-site. Available on iOS and Android.
Applications
Where circuit-level measurement pays for itself fastest on an industrial site.
Industrial Power Monitoring
Monitor motor loads, compressors, HVAC, and production lines individually. Identify phantom loads, poor power factor penalties, and inefficient schedules.
Production Line Attribution
A meter per line turns kWh into kWh-per-unit. Specific energy consumption by line, shift and product is the number that survives a management review — and the one that shows which line degraded.
Compressed Air & Utilities
Compressors are typically the largest single motor load in a plant and the most wasteful. Metering them separately exposes leak-driven duty cycling, unloaded running and poorly sequenced multi-compressor sets.
Multi-Plant Benchmarking
The same process running 15% heavier at one plant than another is a finding you can only reach by comparing normalised data across sites — not from single-plant dashboards.
DG Sets & Standby Power
Metering diesel generators separately gives you a true cost per kWh generated versus grid, which is usually the single biggest saving lever on an Indian industrial site.
Integration: What Actually Talks to What
On an industrial site the energy monitoring system is never the only system. There is a PLC on the line, usually a SCADA above it, sometimes an MES or ERP that wants consumption against a work order, and increasingly a BMS for the utility block. A meter that only speaks one protocol forces a gateway into the data path, and every gateway is a licence, a configuration file and a thing that fails at 2 a.m.
Titan speaks all of the following natively, with no converter hardware:
- Modbus RTU over RS485 — the default for a PLC, SCADA or local historian. Titan can act as a slave or as a bus master polling other devices.
- BACnet MS/TP over the same RS485 port — selected instead of Modbus RTU at commissioning, because RS485 is a single physical bus and carries one protocol at a time.
- Modbus TCP on port 502 and BACnet/IP over Ethernet or WiFi — the same register map and the same measurements, over the network instead of a serial pair.
- MQTT to any broker you configure — AWS IoT, Azure IoT Hub, HiveMQ, Mosquitto or your own — TLS-secured, for a cloud or in-house analytics pipeline.
- HTTP / HTTPS push or raw TCP/IP push of a JSON instant frame to an endpoint you nominate, when you would rather the meter talk to you than be polled.
- An on-device REST interface for provisioning and commissioning only — WiFi setup, transport selection, RS485 role, OTA and status reads. Bulk interval data comes over Modbus, BACnet or MQTT, not REST.
Modbus and MQTT run at the same time, so a local SCADA and your cloud can read the same meter without contending for it. Every one of these paths works without a Tech OVN server: Modbus and BACnet are local and need no internet connection at all, MQTT publishes wherever you point it, and the push transports post to your endpoint. The platform is a convenience, not a dependency.
The full Modbus register map, the MQTT topic scheme and command reference, the JSON schemas and worked decode examples are published openly — with runnable Python — so your engineers can build and test the integration before raising a PO.
Measurement & Hardware Specification
The meter behind the monitoring is the Titan 3-phase DIN rail meter. These are the numbers a plant engineer or a specifier asks for, in full.
| Parameter | Specification |
|---|---|
| Accuracy class (active energy) | Class 0.5S per IEC 62053-22 — the class specified in most industrial and LT-panel tenders |
| Accuracy class (reactive) | Class 1 per IEC 62053-23 |
| Voltage range | 48 V to 500 V AC, 3-phase 4-wire or 3-phase 3-wire |
| Current range | 100 A / 200 A / 400 A / 800 A via LVCT; CT primary 10 A – 1000 A |
| Frequency | 50 / 60 Hz |
| Parameters measured | V, I, P, PF, f, kWh, kVARh, kVAh, import and export |
| Demand | Maximum demand (kW, kVA, A), block and sliding window, configurable 1 / 5 / 15 / 30 / 60 min |
| Harmonics | Individual voltage and current harmonics to the 31st order, per phase |
| Distortion | THD-V and THD-I per phase, computed to the 31st harmonic |
| Advanced metrics | Load hours, power cycles, on-device CO₂ using a configurable grid emission factor |
| Tariff registers | Time-of-use / ToD registers configurable on-device |
| Wired protocols | RS485 — Modbus RTU or BACnet MS/TP, selectable at commissioning |
| Network protocols | Modbus TCP and BACnet/IP over Ethernet or WiFi; MQTT to any broker, TLS-secured |
| Push transports | HTTP / HTTPS JSON frame, or raw TCP/IP socket, to an endpoint you nominate |
| Gateway required | None. WiFi and Ethernet are built in — no serial-to-Ethernet converter, no data concentrator, no per-site energy server |
| Mounting | DIN rail, 94 × 89 × 69 mm — fits an existing MCC or sub-board without panel rework |
| Enclosure | Self-extinguishing UL94 V-0, IP51 front face |
| Operating temperature | −25 °C to +70 °C — rated for switchgear and un-air-conditioned plant rooms |
| Firmware | OTA updates; metrology does not drift, so no periodic recalibration is required |
| Commissioning | Titan smartphone app over WiFi — no laptop, serial cable or proprietary software |
How Many Meters Does a Factory Need, and Where
The most common deployment mistake is metering everything at once. The second most common is metering only the incomer and concluding that monitoring does not work.
- 1
Start at the incomer
One meter on the main gives you the site total, your true maximum demand profile and your power factor against the tariff. This alone tells you whether you have a penalty problem, which is usually the fastest payback on the whole project.
- 2
Then the three biggest motors
Compressors, chillers and the largest process drives. In most plants these three categories are the majority of the motor load, and they are where degradation and bad sequencing hide.
- 3
Then one meter per production line
This is the step that converts energy data into something operations will actually use, because it produces kWh per unit rather than kWh per month.
- 4
Then DG sets and shared utilities
Generators, pumps, lighting and HVAC for the utility block. By this point the heavy consumers have revealed themselves and you are metering to confirm rather than to discover.
Because catalogue meters have no minimum order quantity, this can genuinely be done in stages — one meter, then four, then thirty — rather than as a single capital project. The energy meter sizing calculator will pick the CT rating for each point, and Titan Audit can survey a running plant with clamp-on split-core CTs first if you want evidence before committing to permanent meters.
Price, MOQ and Lead Time
Published rather than quoted on request, because the first question every plant engineer asks is what a measurement point costs.
| Parameter | Specification |
|---|---|
| Indicative price | ₹8,500 to ₹18,300 per meter depending on variant — per measurement point, not per site |
| MOQ — catalogue | None. A pilot on one feeder is a valid order, shipped 4 weeks from confirmed PO |
| Lead time | 4 weeks from confirmed PO |
| Per-site software or licence | None required. Modbus and BACnet are local and work with no internet connection; the platform is optional |
| White-label / OEM | Branding-only from 500 units, 4 weeks from PO. Custom enclosure, bespoke register map or custom firmware from 1000 units, 8–12 weeks |
| Standards and origin | IEC 62053-22 Class 0.5S, IEC 62053-23, EMC per the IEC 61000-4 series. Designed and manufactured in India |
Frequently Asked Questions
Common questions about energy monitoring systems, deployment, and ROI.
Related Solutions & Products
Explore adjacent solutions and the meters that power them.
Energy Management System (EMS)
The complete cloud EMS that sits above the meters — multi-site dashboards, ISO 50001 EnPI tracking, and industry-specific views for factories, hospitals, commercial buildings, and data centres.
Learn More →Building Energy Monitoring
The commercial-premises counterpart to this page — offices, malls, hotels and campuses, where HVAC is most of the load and tenants need separate supplies.
Learn More →Facility Management
One measurement layer serving the energy budget and the maintenance budget together.
Learn More →IoT Energy Meter
Cloud-connected energy metering with built-in WiFi and Ethernet. A smart energy meter using IoT — no gateway needed.
Learn More →Energy Efficiency
Reduce electricity costs in factories through demand management, power factor correction, and phantom load elimination.
Learn More →Titan Smart Energy Meter
Class 0.5S 3-phase DIN rail meter with built-in WiFi, Ethernet, and RS485. The meter behind the monitoring.
Learn More →Energy Meter Sizing Calculator
Size the right meter and CT rating for your facility — one meter on the main plus sub-meters on major feeders.
Learn More →kVA to kW Converter
Convert nameplate ratings to real load currents when planning a multi-meter deployment.
Learn More →Ready to see where your energy goes?
Talk to our team about deploying a real-time energy monitoring system across your facility or campus.