
Energy Management System for Factories & Manufacturing Plants
A factory-grade Energy Management System (EMS) on the Tech OVN Energy Intelligence Platform — attributing every kWh to a line, shift, or machine. BEE PAT-ready reports and ISO 50001 EnPI tracking, deployed across cement, textile, pharma, food-processing, and automotive plants.
Energy Bills Don't Tell You Which Line Is Bleeding
Monthly utility bills tell you what the plant consumed. They don't tell you that compressor #3 is running unloaded for two hours every shift, that the chiller is set to 6°C when 8°C would satisfy the process, or that the second shift is using 18% more energy per tonne than the first. A real Energy Management System attributes every kWh to a line, a shift, and a machine — so the patterns hidden in the aggregate become visible.
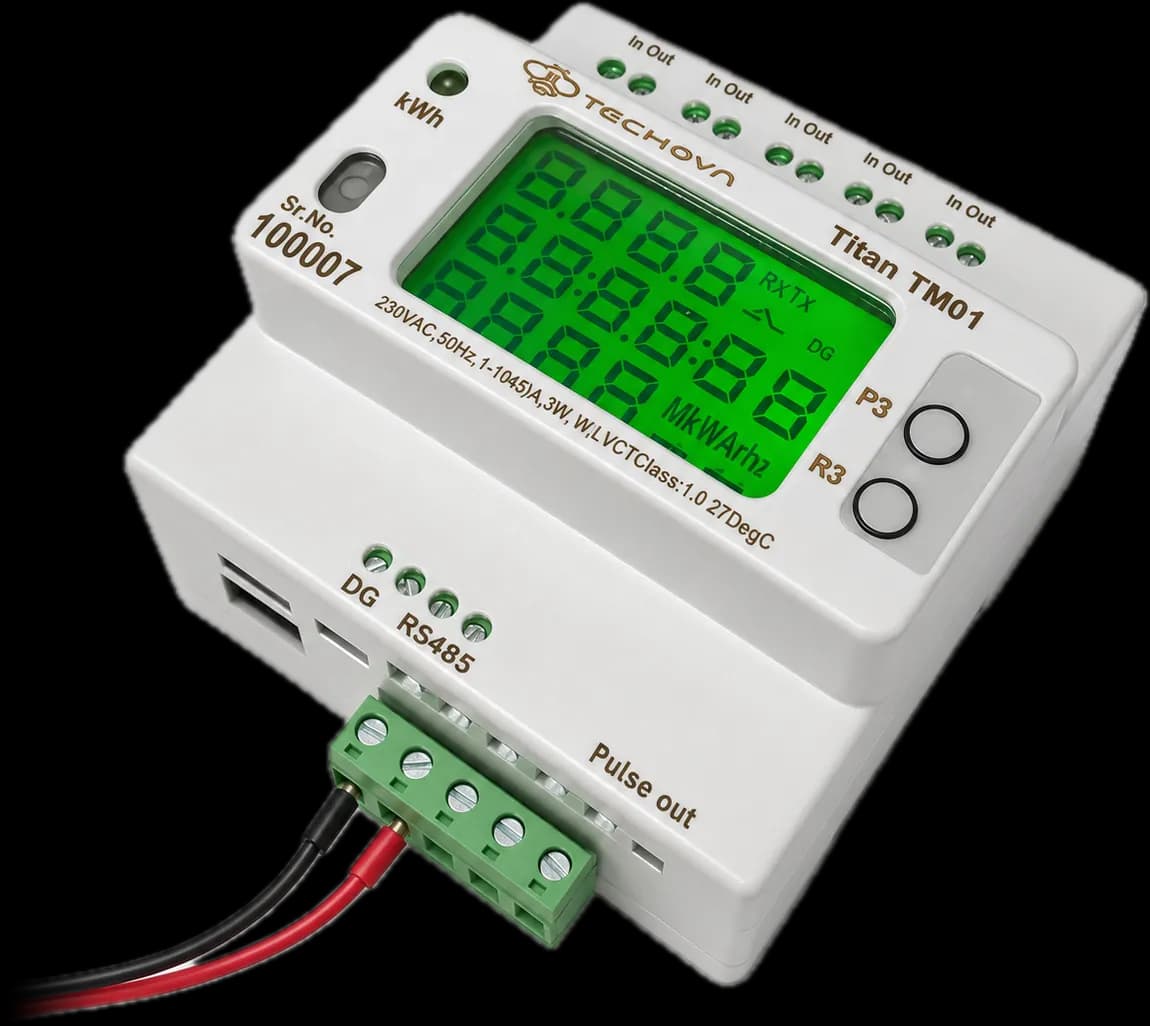
The Tech OVN EMS combines Titan DIN rail submeters on every major feeder with the Tech OVN Energy Intelligence Platform — a multi-site cloud dashboard that calculates Specific Energy Consumption (SEC), tracks EnPIs against your baseline, and exports BEE PAT and ISO 50001 reports automatically. Used by cement, textile, pharmaceutical, food-processing, and automotive plants across India and Southeast Asia.
What a Factory EMS Does
Six capabilities that turn a passive monitoring dashboard into a plant-floor optimisation tool.
Per-Line, Per-Shift Attribution
Attribute kWh and cost to production lines, shifts, and machines — not just to the plant feeder. Spot the line, machine, or shift driving SEC drift before it shows up in the monthly bill.
BEE PAT & ISO 50001 EnPI Tracking
Automatic Specific Energy Consumption (SEC) and EnPI calculation against your baseline. Audit-ready reports for the Bureau of Energy Efficiency's PAT cycle and ISO 50001 EnMS reviews.
Compressed Air, HVAC & Motor Waste
Sub-meter compressed air systems, chillers, AHUs, and large motors separately. Most plants discover 10–20% waste in compressed air leaks and mis-set HVAC schedules within the first month.
Demand Management & MD Penalty Avoidance
Real-time alerts when contract demand is about to be breached. Schedule non-critical loads off-peak and avoid maximum-demand penalties that quietly add 5–10% to industrial bills.
Production Data Entry for SEC
Plug your production totals (tonnes, units, batches) into the platform — either via manual entry or scheduled CSV upload — and the EMS computes kWh-per-tonne and EnPI automatically. No SCADA/MES integration required to get SEC working.
Multi-Plant Portfolio View
Benchmark energy intensity across your factories — kWh per tonne, kWh per unit produced, kWh per shift. Identify your most efficient plant and replicate its operating pattern.
Frequently Asked Questions
BEE PAT, SEC tracking, MES integration, ROI, and deployment timelines — common questions from plant managers and corporate energy heads.
Make every kWh in your plant traceable
Talk to our team about a pilot at one of your plants. Titan meters, Tech OVN Energy Intelligence Platform, ISO 50001-ready, BEE PAT-compatible.